The Hartford 2010 Annual Report Download - page 37
Download and view the complete annual report
Please find page 37 of the 2010 The Hartford annual report below. You can navigate through the pages in the report by either clicking on the pages listed below, or by using the keyword search tool below to find specific information within the annual report.-
 1
1 -
2
-
3
-
4
-
5
-
6
-
7
-
8
-
9
-
10
-
11
-
12
-
13
-
14
-
15
-
16
-
17
-
18
-
19
-
20
-
21
-
22
-
23
-
24
-
25
-
26
-
 27
27 -
 28
28 -
 29
29 -
 30
30 -
 31
31 -
 32
32 -
 33
33 -
 34
34 -
 35
35 -
 36
36 -
 37
37 -
 38
38 -
 39
39 -
 40
40 -
 41
41 -
 42
42 -
 43
43 -
 44
44 -
 45
45 -
 46
46 -
 47
47 -
48
-
49
-
50
-
51
-
52
-
53
-
54
-
55
-
56
-
57
-
58
-
59
-
60
-
61
-
62
-
63
-
64
-
65
-
66
-
67
-
68
-
69
-
70
-
71
-
72
-
73
-
74
-
75
-
76
-
77
-
78
-
79
-
80
-
81
-
82
-
83
-
84
-
85
-
86
-
87
-
88
-
89
-
90
-
91
-
92
-
93
-
94
-
95
-
96
-
97
-
98
-
99
-
100
-
101
-
102
-
103
-
104
-
105
-
106
-
107
-
108
-
109
-
110
-
111
-
112
-
113
-
114
-
115
-
116
-
117
-
118
-
119
-
120
-
121
-
122
-
123
-
124
-
125
-
126
-
127
-
128
-
129
-
130
-
131
-
132
-
133
-
134
-
135
-
136
-
137
-
138
-
139
-
140
-
141
-
142
-
143
-
144
-
145
-
146
-
147
-
148
-
149
-
150
-
151
-
152
-
153
-
154
-
155
-
156
-
157
-
158
-
159
-
160
-
161
-
162
-
163
-
164
-
165
-
166
-
167
-
168
-
169
-
170
-
171
-
172
-
173
-
174
-
175
-
176
-
177
-
178
-
179
-
180
-
181
-
182
-
183
-
184
-
185
-
186
-
187
-
188
-
189
-
190
-
191
-
192
-
193
-
194
-
195
-
196
-
197
-
198
-
199
-
200
-
201
-
202
-
203
-
204
-
205
-
206
-
207
-
208
-
209
-
210
-
211
-
212
-
213
-
214
-
215
-
216
-
217
-
218
-
219
-
220
-
221
-
222
-
223
-
224
-
225
-
226
-
227
-
228
-
229
-
230
-
231
-
232
-
233
-
234
-
235
-
236
-
237
-
238
-
239
-
240
-
241
-
242
-
243
-
244
-
245
-
246
-
247
-
248
 |
 |
37
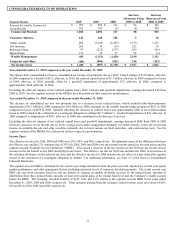
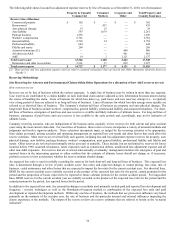
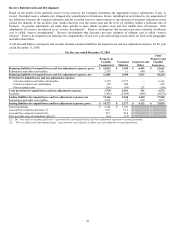
As of December 31, 2010 and 2009, net property and casualty insurance product reserves for losses and loss adjustment expenses
reported under accounting principles generally accepted in the United States of America (“U.S. GAAP”) were approximately equal to
net reserves reported on a statutory basis. Under U.S. GAAP, liabilities for unpaid losses for permanently disabled workers’
compensation claimants are discounted at rates that are no higher than risk-free interest rates and which generally exceed the statutory
discount rates set by regulators, such that workers’ compensation reserves for statutory reporting are higher than the reserves for U.S.
GAAP reporting. Largely offsetting the effect of the difference in discounting is that a portion of the U.S. GAAP provision for
uncollectible reinsurance is not recognized under statutory accounting. Most of the Company’ s property and casualty insurance product
reserves are not discounted. However, the Company has discounted liabilities funded through structured settlements and has discounted
certain reserves for indemnity payments due to permanently disabled claimants under workers' compensation policies.
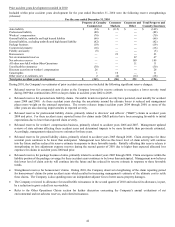
Provided below is a general discussion of which methods are preferred by line of business. Because the actuarial estimates are
generated at a much finer level of detail than line of business (e.g., by distribution channel, coverage, accident period), this description
should not be assumed to apply to each coverage and accident year within a line of business. Also, as circumstances change, the
methods that are given more influence will change.
Property and Auto Physical Damage. These lines are fast-developing and paid and reported development techniques are used as these
methods use historical data to develop paid and reported loss development patterns, which are then applied to current paid and reported
losses by accident period to estimate ultimate losses. The Company relies primarily on reported development techniques although a
review of frequency and severity and the initial loss expectation based on the expected loss ratio is used for the most immature accident
months. The advantage of frequency / severity techniques is that frequency estimates are generally easier to predict and external
information can be used to supplement internal data in making severity estimates.
Personal Auto Liability. For auto liability, and bodily injury in particular, the Company performs a greater number of techniques than it
does for property and auto physical damage. In addition, because the paid development technique is affected by changes in claim
closure patterns and the reported development method is affected by changes in case reserving practices, the Company uses Berquist-
Sherman techniques which adjust these patterns to reflect current settlement rates and case reserving techniques. The Company
generally uses the reported development method for older accident years as a higher percentage of ultimate losses are reflected in
reported losses than in cumulative paid losses and the frequency/severity and Berquist-Sherman methods for more recent accident years.
Recent periods are influenced by changes in case reserve practices and changing disposal rates; the frequency/severity techniques are
not affected as much by these changes and the Berquist-Sherman techniques specifically adjust for these changes.
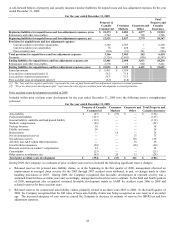
Auto Liability for Commercial Lines and Short-Tailed General Liability. The Company performs a variety of techniques, including the
paid and reported development methods and frequency / severity techniques. For older, more mature accident years, management finds
that reported development techniques are best. For more recent accident years, management typically prefers frequency / severity
techniques that make separate assumptions about loss activity above and below a selected capping level.
Long-Tailed General Liability, Fidelity and Surety and Large Deductible Workers’ Compensation. For these long-tailed lines of
business, the Company generally relies on the expected loss ratio and reported development techniques. Management generally weights
these techniques together, relying more heavily on the expected loss ratio method at early ages of development and more on the reported
development method as an accident year matures.
Workers’ Compensation. Workers’ compensation is the Company’ s single largest reserve line of business so a wide range of methods
are reviewed in the reserve analysis. Methods performed include paid and reported development, variations on expected loss ratio
methods, and an in-depth analysis on the largest states. Historically, paid development patterns in the Company’ s workers’
compensation business have been stable, so paid techniques are preferred for older accident periods. For more recent periods, paid
techniques are less predictive of the ultimate liability since such a low percentage of ultimate losses are paid in early periods of
development. Accordingly, for more recent accident periods, the Company generally relies more heavily on a state-by-state analysis and
the expected loss ratio approach.
Professional Liability. Reported and paid loss developments patterns for this line tend to be volatile. Therefore, the Company typically
relies on frequency and severity techniques.
Assumed Reinsurance and All Other. For these lines, management tends to rely on the reported development techniques. In assumed
reinsurance, assumptions are influenced by information gained from claim and underwriting audits.
Allocated Loss Adjustment Expenses (ALAE). For some lines of business (e.g., professional liability and assumed reinsurance), ALAE
and losses are analyzed together. For most lines of business, however, ALAE is analyzed separately, using paid development
techniques and an analysis of the relationship between ALAE and loss payments.