The Hartford 2010 Annual Report Download - page 133
Download and view the complete annual report
Please find page 133 of the 2010 The Hartford annual report below. You can navigate through the pages in the report by either clicking on the pages listed below, or by using the keyword search tool below to find specific information within the annual report.-
 1
1 -
2
-
3
-
4
-
5
-
6
-
7
-
8
-
9
-
10
-
11
-
12
-
13
-
14
-
15
-
16
-
17
-
18
-
19
-
20
-
21
-
22
-
23
-
24
-
25
-
26
-
27
-
28
-
29
-
30
-
31
-
32
-
33
-
34
-
35
-
36
-
37
-
38
-
39
-
40
-
41
-
42
-
43
-
44
-
45
-
46
-
47
-
48
-
49
-
50
-
51
-
52
-
53
-
54
-
55
-
56
-
57
-
58
-
59
-
60
-
61
-
62
-
63
-
64
-
65
-
66
-
67
-
68
-
69
-
70
-
71
-
72
-
73
-
74
-
75
-
76
-
77
-
78
-
79
-
80
-
81
-
82
-
83
-
84
-
85
-
86
-
87
-
88
-
89
-
90
-
91
-
92
-
93
-
94
-
95
-
96
-
97
-
98
-
99
-
100
-
101
-
102
-
103
-
104
-
105
-
106
-
107
-
108
-
109
-
110
-
111
-
112
-
113
-
114
-
115
-
116
-
117
-
118
-
119
-
120
-
121
-
122
-
 123
123 -
 124
124 -
 125
125 -
 126
126 -
 127
127 -
 128
128 -
 129
129 -
 130
130 -
 131
131 -
 132
132 -
 133
133 -
 134
134 -
 135
135 -
 136
136 -
 137
137 -
 138
138 -
 139
139 -
 140
140 -
 141
141 -
 142
142 -
 143
143 -
144
-
145
-
146
-
147
-
148
-
149
-
150
-
151
-
152
-
153
-
154
-
155
-
156
-
157
-
158
-
159
-
160
-
161
-
162
-
163
-
164
-
165
-
166
-
167
-
168
-
169
-
170
-
171
-
172
-
173
-
174
-
175
-
176
-
177
-
178
-
179
-
180
-
181
-
182
-
183
-
184
-
185
-
186
-
187
-
188
-
189
-
190
-
191
-
192
-
193
-
194
-
195
-
196
-
197
-
198
-
199
-
200
-
201
-
202
-
203
-
204
-
205
-
206
-
207
-
208
-
209
-
210
-
211
-
212
-
213
-
214
-
215
-
216
-
217
-
218
-
219
-
220
-
221
-
222
-
223
-
224
-
225
-
226
-
227
-
228
-
229
-
230
-
231
-
232
-
233
-
234
-
235
-
236
-
237
-
238
-
239
-
240
-
241
-
242
-
243
-
244
-
245
-
246
-
247
-
248
 |
 |

F-5
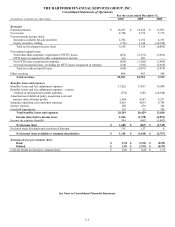
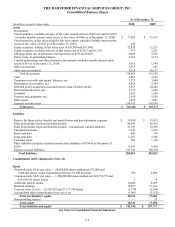
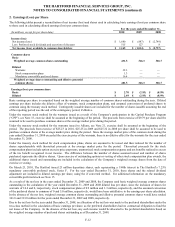
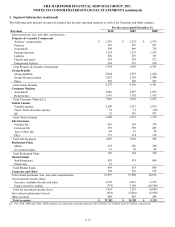
THE HARTFORD FINANCIAL SERVICES GROUP, INC.
Consolidated Statements of Changes in Equity
For the years ended December 31,
(In millions, except for share data) 2010 2009 2008
Preferred Stock, at beginning of period $ 2,960 $ — $ —
Issuance of mandatory convertible preferred stock 556
— —
Accretion of preferred stock discount on issuance to U.S. Treasury — 40 —
Accelerated accretion of discount from redemption of preferred stock issued to U.S. Treasury 440
— —
Issuance (redemption) of preferred stock to the U.S. Treasury (3,400)
2,920 —
Preferred Stock, at end of period 556 2,960 —
Common Stock 5 4 3
Additional Paid-in Capital, at beginning of period 8,985
7,569 6,627
Issuance of warrants to U.S. Treasury —
480 —
Issuance of shares under discretionary equity issuance plan —
887 —
Issuance of convertible preferred shares — — 727
Issuance of warrants — — 240
Issuance of shares under public offering 1,599
— —
Issuance of shares under incentive and stock compensation plans (130)
(126) (36)
Reclassification of warrants from other liabilities to equity and extension of warrants’ term —
186 —
Tax expense on employee stock options and awards (6)
(11) 11
Additional Paid-in Capital, at end of period 10,448 8,985 7,569
Retained Earnings, at beginning of period, before cumulative effect of accounting change, net of tax 11,164 11,336 14,686
Cumulative effect of accounting change, net of tax 26
— (3)
Retained Earnings, at beginning of period, as adjusted 11,190 11,336 14,683
Net income (loss) 1,680
(887) (2,749)
Cumulative effect of accounting changes, net of tax (194)
912 —
Accretion of preferred stock discount on issuance to U.S. Treasury —
(40) —
Accelerated accretion of discount from redemption of preferred stock issued to U.S. Treasury (440)
— —
Dividends on preferred stock (75)
(87) (8)
Dividends declared on common stock (84)
(70) (590)
Retained Earnings, at end of period 12,077 11,164 11,336
Treasury Stock, at Cost, at beginning of period (1,936)
(2,120) (1,254)
Treasury stock acquired — — (1,000)
Issuance of shares under incentive and stock compensation plans from treasury stock 165
187 152
Return of shares under incentive and stock compensation plans to treasury stock (3)
(3) (18)
Treasury Stock, at Cost, at end of period (1,774) (1,936) (2,120)
Accumulated Other Comprehensive Loss, Net of Tax, at beginning of period (3,312)
(7,520) (858)
Cumulative effect of accounting change, net of tax 194
(912) —
Total other comprehensive income 2,117
5,120 (6,662)
Accumulated Other Comprehensive Loss, Net of Tax, at end of period (1,001) (3,312) (7,520)
Total Stockholders’ Equity 20,311 17,865 9,268
Noncontrolling Interest, at beginning of period (Note 15) 29 92 92
Change in noncontrolling interest ownership — (56) 57
Noncontrolling loss — (7) (57)
Recognition of noncontrolling interest in other liabilities (29) — —
Noncontrolling Interest, at end of period — 29 92
Total Equity $ 20,311 $ 17,894 $ 9,360
Preferred Shares Outstanding, at beginning of period (in thousands) 3,400
6,048 —
Issuance of convertible preferred shares — — 6,048
Conversion of preferred to common shares —
(6,048) —
Issuance of shares to U.S. Treasury —
3,400 —
Issuance of mandatory convertible preferred shares 575 — —
Redemption of preferred shares issued to the U.S. Treasury (3,400) — —
Preferred Shares Outstanding, at end of period 575 3,400 6,048
Common Shares Outstanding, at beginning of period (in thousands) 383,007
300,579 313,842
Treasury stock acquired —
(27) (14,682)
Conversion of preferred to common shares —
24,194 —
Issuance of shares under discretionary equity issuance plan —
56,109 —
Issuance of shares under public offering 59,590 — —
Issuance of shares under incentive and stock compensation plans 2,095
2,356 1,673
Return of shares under incentive and stock compensation plans to treasury stock (143)
(204) (254)
Common Shares Outstanding, at end of period 444,549 383,007 300,579
See Notes to Consolidated Financial Statements.