The Hartford 2010 Annual Report Download - page 168
Download and view the complete annual report
Please find page 168 of the 2010 The Hartford annual report below. You can navigate through the pages in the report by either clicking on the pages listed below, or by using the keyword search tool below to find specific information within the annual report.-
 1
1 -
2
-
3
-
4
-
5
-
6
-
7
-
8
-
9
-
10
-
11
-
12
-
13
-
14
-
15
-
16
-
17
-
18
-
19
-
20
-
21
-
22
-
23
-
24
-
25
-
26
-
27
-
28
-
29
-
30
-
31
-
32
-
33
-
34
-
35
-
36
-
37
-
38
-
39
-
40
-
41
-
42
-
43
-
44
-
45
-
46
-
47
-
48
-
49
-
50
-
51
-
52
-
53
-
54
-
55
-
56
-
57
-
58
-
59
-
60
-
61
-
62
-
63
-
64
-
65
-
66
-
67
-
68
-
69
-
70
-
71
-
72
-
73
-
74
-
75
-
76
-
77
-
78
-
79
-
80
-
81
-
82
-
83
-
84
-
85
-
86
-
87
-
88
-
89
-
90
-
91
-
92
-
93
-
94
-
95
-
96
-
97
-
98
-
99
-
100
-
101
-
102
-
103
-
104
-
105
-
106
-
107
-
108
-
109
-
110
-
111
-
112
-
113
-
114
-
115
-
116
-
117
-
118
-
119
-
120
-
121
-
122
-
123
-
124
-
125
-
126
-
127
-
128
-
129
-
130
-
131
-
132
-
133
-
134
-
135
-
136
-
137
-
138
-
139
-
140
-
141
-
142
-
143
-
144
-
145
-
146
-
147
-
148
-
149
-
150
-
151
-
152
-
153
-
154
-
155
-
156
-
157
-
 158
158 -
 159
159 -
 160
160 -
 161
161 -
 162
162 -
 163
163 -
 164
164 -
 165
165 -
 166
166 -
 167
167 -
 168
168 -
 169
169 -
 170
170 -
 171
171 -
 172
172 -
 173
173 -
 174
174 -
 175
175 -
 176
176 -
 177
177 -
 178
178 -
179
-
180
-
181
-
182
-
183
-
184
-
185
-
186
-
187
-
188
-
189
-
190
-
191
-
192
-
193
-
194
-
195
-
196
-
197
-
198
-
199
-
200
-
201
-
202
-
203
-
204
-
205
-
206
-
207
-
208
-
209
-
210
-
211
-
212
-
213
-
214
-
215
-
216
-
217
-
218
-
219
-
220
-
221
-
222
-
223
-
224
-
225
-
226
-
227
-
228
-
229
-
230
-
231
-
232
-
233
-
234
-
235
-
236
-
237
-
238
-
239
-
240
-
241
-
242
-
243
-
244
-
245
-
246
-
247
-
248
 |
 |

THE HARTFORD FINANCIAL SERVICES GROUP, INC.
NOTES TO CONSOLIDATED FINANCIAL STATEMENTS (continued)
F-40
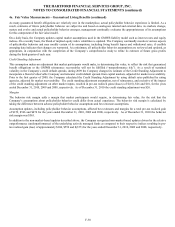
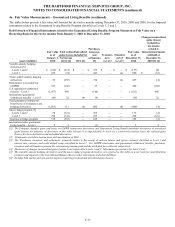
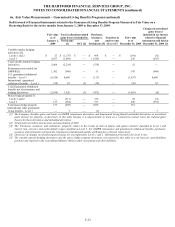
5. Investments and Derivative Instruments (continued)
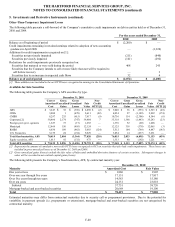
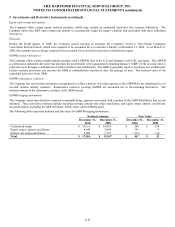
Other-Than-Temporary Impairment Losses
The following table presents a roll-forward of the Company’ s cumulative credit impairments on debt securities held as of December 31,
2010 and 2009.
For the years ended December 31,
2010 2009
Balance as of beginning of period $ (2,200) $ —
Credit impairments remaining in retained earnings related to adoption of new accounting
guidance in April 2009 — (1,320)
Additions for credit impairments recognized on [1]:
Securities not previously impaired (211) (840)
Securities previously impaired (161) (292)
Reductions for credit impairments previously recognized on:
Securities that matured or were sold during the period 468 245
Securities that the Company intends to sell or more likely than not will be required to
sell before recovery — 3
Securities due to an increase in expected cash flows 32 4
Balance as of end of period $ (2,072) $ (2,200)
[1] These additions are included in the net OTTI losses recognized in earnings in the Consolidated Statements of Operations.
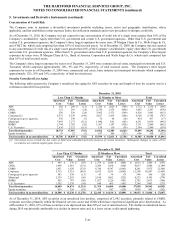
Available-for-Sale Securities
The following table presents the Company’ s AFS securities by type.
December 31, 2010 December 31, 2009
Cost or
Amortized
Cost
Gross
Unrealized
Gains
Gross
Unrealized
Losses
Fair
Value
Non-
Credit
OTTI [1]
Cost or
Amortized
Cost
Gross
Unrealized
Gains
Gross
Unrealized
Losses
Fair
Value
Non-
Credit
OTTI [1]
ABS $ 3,247 $ 38 $(396) $2,889 $ (2) $ 3,040 $ 36 $ (553) $ 2,523 $ (48)
CDOs 3,088
1 (478) 2,611 (82) 4,054 27 (1,189) 2,892 (174)
CMBS 8,297
235 (615) 7,917 (9) 10,736 114 (2,306) 8,544 (6)
Corporate [2] 38,496 2,174 (747) 39,884 7 35,318 1,368 (1,443) 35,243 (23)
Foreign govt./govt. agencies 1,627 73 (17) 1,683 — 1,376 52 (20) 1,408 —
Municipal 12,469
150 (495) 12,124 — 12,125 318 (378) 12,065 (3)
RMBS 6,036
109 (462) 5,683 (124) 5,512 104 (769) 4,847 (185)
U.S. Treasuries 5,159 24 (154) 5,029 — 3,854 14 (237) 3,631 —
Total fixed maturities, AFS 78,419 2,804 (3,364) 77,820 (210) 76,015 2,033 (6,895) 71,153 (439)
Equity securities, AFS 1,013 92 (132) 973 — 1,333 80 (192) 1,221 —
Total AFS securities $ 79,432 $ 2,896 $(3,496) $78,793 $ (210) $ 77,348 $ 2,113 $ (7,087) $ 72,374 $ (439)
[1] Represents the amount of cumulative non-credit OTTI losses recognized in OCI on securities that also had credit impairments. These losses are
included in gross unrealized losses as of December 31, 2010 and 2009.
[2] Gross unrealized gains (losses) exclude the fair value of bifurcated embedded derivative features of certain securities. Subsequent changes in
value will be recorded in net realized capital gains (losses).
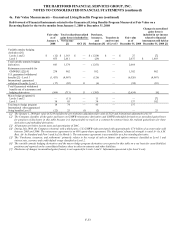
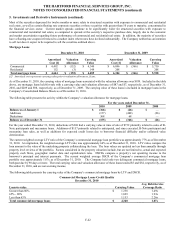
The following table presents the Company’ s fixed maturities, AFS, by contractual maturity year.
December 31, 2010
Maturity Amortized Cost Fair Value
One year or less $ 1,886 $ 1,905
Over one year through five years 17,151 17,817
Over five years through ten years 14,563 15,180
Over ten years 24,151 23,818
Subtotal 57,751 58,720
Mortgage-backed and asset-backed securities 20,668 19,100
Total $ 78,419 $ 77,820
Estimated maturities may differ from contractual maturities due to security call or prepayment provisions. Due to the potential for
variability in payment spreads (i.e. prepayments or extensions), mortgage-backed and asset-backed securities are not categorized by
contractual maturity.