The Hartford 2010 Annual Report Download - page 104
Download and view the complete annual report
Please find page 104 of the 2010 The Hartford annual report below. You can navigate through the pages in the report by either clicking on the pages listed below, or by using the keyword search tool below to find specific information within the annual report.-
 1
1 -
2
-
3
-
4
-
5
-
6
-
7
-
8
-
9
-
10
-
11
-
12
-
13
-
14
-
15
-
16
-
17
-
18
-
19
-
20
-
21
-
22
-
23
-
24
-
25
-
26
-
27
-
28
-
29
-
30
-
31
-
32
-
33
-
34
-
35
-
36
-
37
-
38
-
39
-
40
-
41
-
42
-
43
-
44
-
45
-
46
-
47
-
48
-
49
-
50
-
51
-
52
-
53
-
54
-
55
-
56
-
57
-
58
-
59
-
60
-
61
-
62
-
63
-
64
-
65
-
66
-
67
-
68
-
69
-
70
-
71
-
72
-
73
-
74
-
75
-
76
-
77
-
78
-
79
-
80
-
81
-
82
-
83
-
84
-
85
-
86
-
87
-
88
-
89
-
90
-
91
-
92
-
93
-
 94
94 -
 95
95 -
 96
96 -
 97
97 -
 98
98 -
 99
99 -
 100
100 -
 101
101 -
 102
102 -
 103
103 -
 104
104 -
 105
105 -
 106
106 -
 107
107 -
 108
108 -
 109
109 -
 110
110 -
 111
111 -
 112
112 -
 113
113 -
 114
114 -
115
-
116
-
117
-
118
-
119
-
120
-
121
-
122
-
123
-
124
-
125
-
126
-
127
-
128
-
129
-
130
-
131
-
132
-
133
-
134
-
135
-
136
-
137
-
138
-
139
-
140
-
141
-
142
-
143
-
144
-
145
-
146
-
147
-
148
-
149
-
150
-
151
-
152
-
153
-
154
-
155
-
156
-
157
-
158
-
159
-
160
-
161
-
162
-
163
-
164
-
165
-
166
-
167
-
168
-
169
-
170
-
171
-
172
-
173
-
174
-
175
-
176
-
177
-
178
-
179
-
180
-
181
-
182
-
183
-
184
-
185
-
186
-
187
-
188
-
189
-
190
-
191
-
192
-
193
-
194
-
195
-
196
-
197
-
198
-
199
-
200
-
201
-
202
-
203
-
204
-
205
-
206
-
207
-
208
-
209
-
210
-
211
-
212
-
213
-
214
-
215
-
216
-
217
-
218
-
219
-
220
-
221
-
222
-
223
-
224
-
225
-
226
-
227
-
228
-
229
-
230
-
231
-
232
-
233
-
234
-
235
-
236
-
237
-
238
-
239
-
240
-
241
-
242
-
243
-
244
-
245
-
246
-
247
-
248
 |
 |

104
GMDB
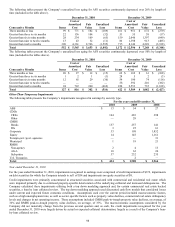
The majority of the Company’ s U.S. variable annuity contracts include a GMDB rider. Declines in the equity markets will increase the
Company’ s liability for GMDB riders. The Company’ s total gross exposure (i.e., before reinsurance) to U.S. GMDB as of December
31, 2010 and December 31, 2009 is $10.7 billion and $18.4 billion, respectively. However, the Company will incur these payments in
the future only if the policyholder has an “in the money” GMDB at their death. As of December 31, 2010 and December 31, 2009, 70%
and 82%, respectively, of all unreinsured U.S. GMDB contracts were “in the money”. For those contracts that were “in the money”, the
average contract was 12% and 18% “in the money” as of December 31, 2010 and 2009, respectively. The Company reinsured 60% and
53% of these death benefit guarantees as of December 31, 2010 and December 31, 2009, respectively. Under certain of these
reinsurance agreements, the reinsurers’ exposure is subject to an annual cap. The Company’ s net exposure (i.e., after reinsurance), is
$4.3 billion and $8.5 billion, as of December 31, 2010 and December 31, 2009, respectively.
In the second quarter of 2009, the Company suspended all new product sales in Japan. Prior to that, the Company offered variable
annuity products in Japan with a GMDB. For the in-force block of Japan business, declines in equity markets, as well as a strengthening
of the Japanese yen in comparison to the U.S. dollar, the euro and other currencies will increase the Company’ s liability for GMDB
riders. This increase may be significant in extreme market scenarios. In general, the GMDB riders entitle the policyholder to receive
the original investment value at the date of death. If the original investment value exceeds the account value upon death then the
contract is “in the money”. As of December 31, 2010 and 2009, substantially all of the unreinsured Japan GMDB contracts were “in the
money”. For those contracts that were “in the money”, the average contract was 22% and 18% “in the money” as of December 31, 2010
and 2009, respectively. The Company’ s total gross exposure (i.e., before reinsurance) to the GMDB offered in Japan is $8.8 billion and
$6.3 billion as of December 31, 2010 and December 31, 2009, respectively. The Company reinsured 14% and 17% of the GMDB to a
third-party reinsurer as of December 31, 2010 and 2009, respectively. Under certain of these reinsurance agreements, the reinsurers’
exposure is subject to an annual cap. The Company’ s net GMDB exposure (i.e. after reinsurance) is $7.6 billion and $5.2 billion as of
December 31, 2010 and 2009, respectively. Many policyholders with a GMDB also have a GMWB in the US or GMIB in Japan.
Policyholders that have a product that offer both guarantees can only receive the GMDB or the GMIB benefit in Japan or the GMDB or
GMWB in the U.S. For additional information on the Company’ s GMDB liability, see Note 9 of the Notes to Consolidated Financial
Statements.
GMIB
In the second quarter of 2009, the Company suspended all new product sales in Japan. Prior to that, the Company offered variable
annuity products in Japan with a GMIB. For GMIB contracts, in general, the policyholder has the right to elect to annuitize benefits,
beginning (for certain products) on the tenth or fifteenth anniversary year of contract commencement, receive lump sum payment of
account value, or remain in the variable sub-account. For GMIB contracts, the policyholder is entitled to receive the original investment
value over a 10- to 15- year annuitization period. A small percentage of the contracts will first become eligible to elect annuitization
beginning in 2013. The remainder of the contracts will first become eligible to elect annuitization from 2014 to 2022. Because
policyholders have various contractual rights to defer their annuitization election, the period over which annuitization election can take
place is subject to policyholder behavior and therefore indeterminate. In addition, upon annuitization the contractholder surrenders
access to the account value and the account value is transferred to the Company’ s general account where it is invested and the additional
investment proceeds are used towards payment of the original investment value. If the original investment value exceeds the account
value upon annuitization then the contract is “in the money”. As of December 31, 2010 and 2009, substantially all of the Japan GMIB
contracts were “in the money”. For those contracts that were “in the money”, the average contract was 17% and 12% “in the money” as
of December 31, 2010 and 2009, respectively. In addition, as of December 31, 2010, 54% of retained net amount at risk is reinsured to
an affiliate of The Hartford. For additional information on the Company’ s GMIB liability, see Note 9 of the Notes to Consolidated
Financial Statements.
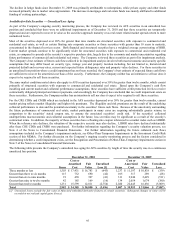
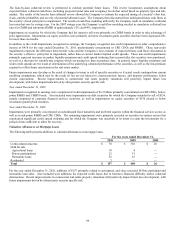
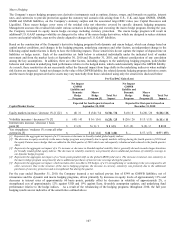
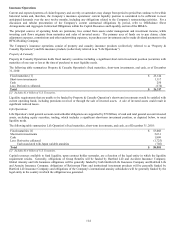
The following table represents the timing of account values eligible for annuitization under the Japan GMIB as of December 31, 2010,
as well as the retained net amount at risk. The account values reflect 100% annuitization at the earliest point allowed by the contract
and no adjustments for future market returns and policyholder behaviors. Future market returns, changes in the value of the Japanese
yen and policyholder behaviors will impact account values eligible for annuitization in the years presented.
GMIB [1]
($ in billions) Account Value Net Amount at Risk
2013 $ 0.3 $ —
2014 4.7 0.7
2015 7.6 1.4
2016 2.6 0.6
2017 2.9 0.7
2018 & beyond [2] 7.3 2.0
Total $ 25.4 $ 5.4
[1] Excludes certain GMIB products where annuitization eligibility is based on attained age.
[2] In 2018 & beyond, $2.8 billion of the $7.3 billion is primarily associated with account value that is eligible in 2021.