The Hartford 2010 Annual Report Download - page 154
Download and view the complete annual report
Please find page 154 of the 2010 The Hartford annual report below. You can navigate through the pages in the report by either clicking on the pages listed below, or by using the keyword search tool below to find specific information within the annual report.-
 1
1 -
2
-
3
-
4
-
5
-
6
-
7
-
8
-
9
-
10
-
11
-
12
-
13
-
14
-
15
-
16
-
17
-
18
-
19
-
20
-
21
-
22
-
23
-
24
-
25
-
26
-
27
-
28
-
29
-
30
-
31
-
32
-
33
-
34
-
35
-
36
-
37
-
38
-
39
-
40
-
41
-
42
-
43
-
44
-
45
-
46
-
47
-
48
-
49
-
50
-
51
-
52
-
53
-
54
-
55
-
56
-
57
-
58
-
59
-
60
-
61
-
62
-
63
-
64
-
65
-
66
-
67
-
68
-
69
-
70
-
71
-
72
-
73
-
74
-
75
-
76
-
77
-
78
-
79
-
80
-
81
-
82
-
83
-
84
-
85
-
86
-
87
-
88
-
89
-
90
-
91
-
92
-
93
-
94
-
95
-
96
-
97
-
98
-
99
-
100
-
101
-
102
-
103
-
104
-
105
-
106
-
107
-
108
-
109
-
110
-
111
-
112
-
113
-
114
-
115
-
116
-
117
-
118
-
119
-
120
-
121
-
122
-
123
-
124
-
125
-
126
-
127
-
128
-
129
-
130
-
131
-
132
-
133
-
134
-
135
-
136
-
137
-
138
-
139
-
140
-
141
-
142
-
143
-
 144
144 -
 145
145 -
 146
146 -
 147
147 -
 148
148 -
 149
149 -
 150
150 -
 151
151 -
 152
152 -
 153
153 -
 154
154 -
 155
155 -
 156
156 -
 157
157 -
 158
158 -
 159
159 -
 160
160 -
 161
161 -
 162
162 -
 163
163 -
 164
164 -
165
-
166
-
167
-
168
-
169
-
170
-
171
-
172
-
173
-
174
-
175
-
176
-
177
-
178
-
179
-
180
-
181
-
182
-
183
-
184
-
185
-
186
-
187
-
188
-
189
-
190
-
191
-
192
-
193
-
194
-
195
-
196
-
197
-
198
-
199
-
200
-
201
-
202
-
203
-
204
-
205
-
206
-
207
-
208
-
209
-
210
-
211
-
212
-
213
-
214
-
215
-
216
-
217
-
218
-
219
-
220
-
221
-
222
-
223
-
224
-
225
-
226
-
227
-
228
-
229
-
230
-
231
-
232
-
233
-
234
-
235
-
236
-
237
-
238
-
239
-
240
-
241
-
242
-
243
-
244
-
245
-
246
-
247
-
248
 |
 |

THE HARTFORD FINANCIAL SERVICES GROUP, INC.
NOTES TO CONSOLIDATED FINANCIAL STATEMENTS (continued)
F-26
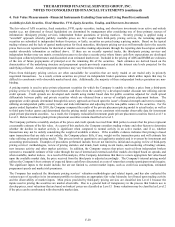
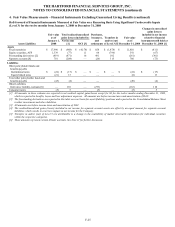
4. Fair Value Measurements –Financial Instruments Excluding Guaranteed Living Benefits (continued)
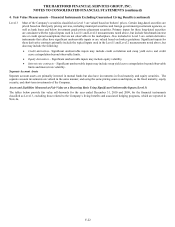
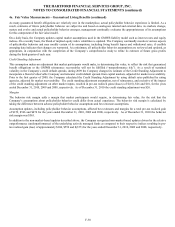
Fair Value Option
The Company elected the fair value option for its investments containing an embedded credit derivative which were not bifurcated as a
result of new accounting guidance effective July 1, 2010. The underlying credit risk of these securities is primarily corporate bonds and
commercial real estate. The Company elected the fair value option given the complexity of bifurcating the economic components
associated with the embedded credit derivative. Similar to other fixed maturities, income earned from these securities is recorded in net
investment income. Changes in the fair value of these securities are recorded in net realized capital gains and losses.
The Company previously elected the fair value option for one of its consolidated VIEs in order to apply a consistent accounting model
for the VIE’ s assets and liabilities. The VIE is an investment vehicle that holds high quality investments, derivative instruments that
references third-party corporate credit and issues notes to investors that reflect the credit characteristics of the high quality investments
and derivative instruments. The risks and rewards associated with the assets of the VIE inure to the investors. The investors have no
recourse against the Company. As a result, there has been no adjustment to the market value of the notes for the Company’ s own credit
risk. Electing the fair value option for the VIE resulted in lowering other liabilities with an offsetting impact to the cumulative effect
adjustment to retained earnings of $232, representing the difference between the fair value and outstanding principal of the notes as of
January 1, 2010.
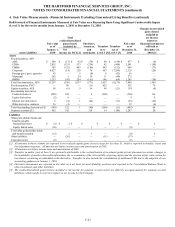
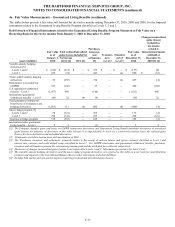
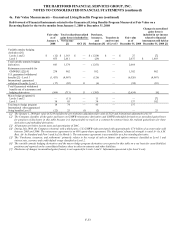
The following table presents the changes in fair value of those assets and liabilities accounted for using the fair value option reported in
net realized capital gains and losses in the Company’ s Consolidated Statements of Operations.
For the year ended
December 31, 2010
Assets
Fixed maturities, FVO
ABS $ (5)
Corporate (7)
CRE CDOs 83
RMBS (1)
Other liabilities
Credit-linked notes (26)
Total realized capital gains (losses) $ 44
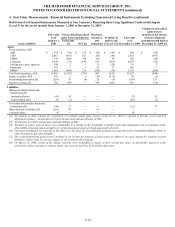
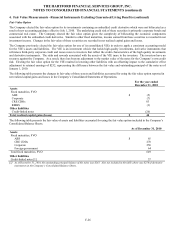
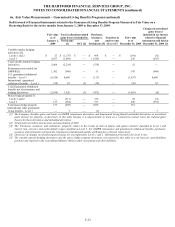
The following table presents the fair value of assets and liabilities accounted for using the fair value option included in the Company’ s
Consolidated Balance Sheets.
As of December 31, 2010
Assets
Fixed maturities, FVO
ABS $ 65
CRE CDOs 270
Corporate 250
Foreign government 64
Total fixed maturities, FVO 649
Other liabilities
Credit-linked notes [1] 37
[1] As of December 31, 2010, the outstanding principal balance of the notes was $243. Also not included in the table above was $250 of derivative
instruments in the Company’s Consolidated Balance Sheets.