The Hartford 2010 Annual Report Download - page 114
Download and view the complete annual report
Please find page 114 of the 2010 The Hartford annual report below. You can navigate through the pages in the report by either clicking on the pages listed below, or by using the keyword search tool below to find specific information within the annual report.-
 1
1 -
2
-
3
-
4
-
5
-
6
-
7
-
8
-
9
-
10
-
11
-
12
-
13
-
14
-
15
-
16
-
17
-
18
-
19
-
20
-
21
-
22
-
23
-
24
-
25
-
26
-
27
-
28
-
29
-
30
-
31
-
32
-
33
-
34
-
35
-
36
-
37
-
38
-
39
-
40
-
41
-
42
-
43
-
44
-
45
-
46
-
47
-
48
-
49
-
50
-
51
-
52
-
53
-
54
-
55
-
56
-
57
-
58
-
59
-
60
-
61
-
62
-
63
-
64
-
65
-
66
-
67
-
68
-
69
-
70
-
71
-
72
-
73
-
74
-
75
-
76
-
77
-
78
-
79
-
80
-
81
-
82
-
83
-
84
-
85
-
86
-
87
-
88
-
89
-
90
-
91
-
92
-
93
-
94
-
95
-
96
-
97
-
98
-
99
-
100
-
101
-
102
-
103
-
 104
104 -
 105
105 -
 106
106 -
 107
107 -
 108
108 -
 109
109 -
 110
110 -
 111
111 -
 112
112 -
 113
113 -
 114
114 -
 115
115 -
 116
116 -
 117
117 -
 118
118 -
 119
119 -
 120
120 -
 121
121 -
 122
122 -
 123
123 -
 124
124 -
125
-
126
-
127
-
128
-
129
-
130
-
131
-
132
-
133
-
134
-
135
-
136
-
137
-
138
-
139
-
140
-
141
-
142
-
143
-
144
-
145
-
146
-
147
-
148
-
149
-
150
-
151
-
152
-
153
-
154
-
155
-
156
-
157
-
158
-
159
-
160
-
161
-
162
-
163
-
164
-
165
-
166
-
167
-
168
-
169
-
170
-
171
-
172
-
173
-
174
-
175
-
176
-
177
-
178
-
179
-
180
-
181
-
182
-
183
-
184
-
185
-
186
-
187
-
188
-
189
-
190
-
191
-
192
-
193
-
194
-
195
-
196
-
197
-
198
-
199
-
200
-
201
-
202
-
203
-
204
-
205
-
206
-
207
-
208
-
209
-
210
-
211
-
212
-
213
-
214
-
215
-
216
-
217
-
218
-
219
-
220
-
221
-
222
-
223
-
224
-
225
-
226
-
227
-
228
-
229
-
230
-
231
-
232
-
233
-
234
-
235
-
236
-
237
-
238
-
239
-
240
-
241
-
242
-
243
-
244
-
245
-
246
-
247
-
248
 |
 |

114
Insurance Operations
Current and expected patterns of claim frequency and severity or surrenders may change from period to period but continue to be within
historical norms and, therefore, the Company’ s insurance operations’ current liquidity position is considered to be sufficient to meet
anticipated demands over the next twelve months, including any obligations related to the Company’ s restructuring activities. For a
discussion and tabular presentation of the Company’ s current contractual obligations by period, refer to Off-Balance Sheet
Arrangements and Aggregate Contractual Obligations within the Capital Resources and Liquidity section of the MD&A.
The principal sources of operating funds are premiums, fees earned from assets under management and investment income, while
investing cash flows originate from maturities and sales of invested assets. The primary uses of funds are to pay claims, claim
adjustment expenses, commissions and other underwriting expenses, to purchase new investments and to make dividend payments to the
HFSG Holding Company.
The Company’ s insurance operations consist of property and casualty insurance products (collectively referred to as “Property &
Casualty Operations”) and life insurance products (collectively referred to as “Life Operations”).
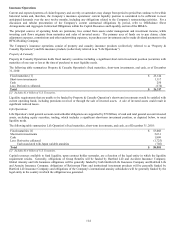
Property & Casualty
Property & Casualty Operations holds fixed maturity securities including a significant short-term investment position (securities with
maturities of one year or less at the time of purchase) to meet liquidity needs.
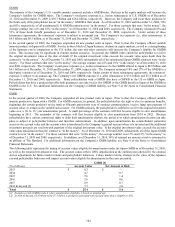
The following table summarizes Property & Casualty Operation’ s fixed maturities, short-term investments, and cash, as of December
31, 2010:
Fixed maturities [1] $ 25,124
Short-term investments 1,117
Cash 250
Less: Derivative collateral (174)
Total $ 26,317
[1] Includes $1.4 billion of U.S. Treasuries.
Liquidity requirements that are unable to be funded by Property & Casualty Operation’ s short-term investments would be satisfied with
current operating funds, including premiums received or through the sale of invested assets. A sale of invested assets could result in
significant realized losses.
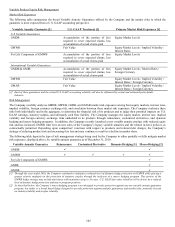
Life Operations
Life Operation’ s total general account contractholder obligations are supported by $70 billion, of cash and total general account invested
assets, excluding equity securities, trading, which includes a significant short-term investment position, as depicted below, to meet
liquidity needs.
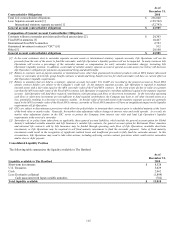
The following table summarizes Life Operation’ s fixed maturities, short-term investments, and cash, as of December 31, 2010:
Fixed maturities [1] $ 53,068
Short-term investments 5,631
Cash 1,809
Less: Derivative collateral (1,725)
Cash associated with Japan variable annuities (702)
Total $ 58,081
[1] Includes $3.4 billion of U.S. Treasuries.
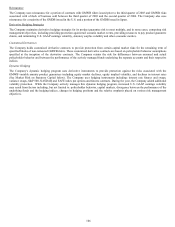
Capital resources available to fund liquidity, upon contract holder surrender, are a function of the legal entity in which the liquidity
requirement resides. Generally, obligations of Group Benefits will be funded by Hartford Life and Accident Insurance Company;
Global Annuity and Life Insurance obligations will be generally funded by both Hartford Life Insurance Company and Hartford Life
and Annuity Insurance Company; obligations of Retirement Plans and institutional investment products will be generally funded by
Hartford Life Insurance Company; and obligations of the Company’ s international annuity subsidiaries will be generally funded by the
legal entity in the country in which the obligation was generated.