The Hartford 2010 Annual Report Download - page 236
Download and view the complete annual report
Please find page 236 of the 2010 The Hartford annual report below. You can navigate through the pages in the report by either clicking on the pages listed below, or by using the keyword search tool below to find specific information within the annual report.-
 1
1 -
2
-
3
-
4
-
5
-
6
-
7
-
8
-
9
-
10
-
11
-
12
-
13
-
14
-
15
-
16
-
17
-
18
-
19
-
20
-
21
-
22
-
23
-
24
-
25
-
26
-
27
-
28
-
29
-
30
-
31
-
32
-
33
-
34
-
35
-
36
-
37
-
38
-
39
-
40
-
41
-
42
-
43
-
44
-
45
-
46
-
47
-
48
-
49
-
50
-
51
-
52
-
53
-
54
-
55
-
56
-
57
-
58
-
59
-
60
-
61
-
62
-
63
-
64
-
65
-
66
-
67
-
68
-
69
-
70
-
71
-
72
-
73
-
74
-
75
-
76
-
77
-
78
-
79
-
80
-
81
-
82
-
83
-
84
-
85
-
86
-
87
-
88
-
89
-
90
-
91
-
92
-
93
-
94
-
95
-
96
-
97
-
98
-
99
-
100
-
101
-
102
-
103
-
104
-
105
-
106
-
107
-
108
-
109
-
110
-
111
-
112
-
113
-
114
-
115
-
116
-
117
-
118
-
119
-
120
-
121
-
122
-
123
-
124
-
125
-
126
-
127
-
128
-
129
-
130
-
131
-
132
-
133
-
134
-
135
-
136
-
137
-
138
-
139
-
140
-
141
-
142
-
143
-
144
-
145
-
146
-
147
-
148
-
149
-
150
-
151
-
152
-
153
-
154
-
155
-
156
-
157
-
158
-
159
-
160
-
161
-
162
-
163
-
164
-
165
-
166
-
167
-
168
-
169
-
170
-
171
-
172
-
173
-
174
-
175
-
176
-
177
-
178
-
179
-
180
-
181
-
182
-
183
-
184
-
185
-
186
-
187
-
188
-
189
-
190
-
191
-
192
-
193
-
194
-
195
-
196
-
197
-
198
-
199
-
200
-
201
-
202
-
203
-
204
-
205
-
206
-
207
-
208
-
209
-
210
-
211
-
212
-
213
-
214
-
215
-
216
-
217
-
218
-
219
-
220
-
221
-
222
-
223
-
224
-
225
-
 226
226 -
 227
227 -
 228
228 -
 229
229 -
 230
230 -
 231
231 -
 232
232 -
 233
233 -
 234
234 -
 235
235 -
 236
236 -
 237
237 -
 238
238 -
 239
239 -
 240
240 -
 241
241 -
 242
242 -
 243
243 -
 244
244 -
 245
245 -
 246
246 -
247
-
248
 |
 |

II-5
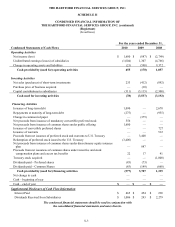
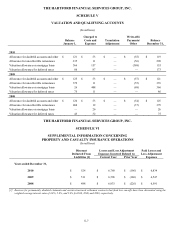
EXHIBIT 12.01
THE HARTFORD FINANCIAL SERVICES GROUP, INC.
COMPUTATION OF RATIOS OF EARNINGS TO FIXED CHARGES
AND PREFERRED SHARE DIVIDENDS
(In millions)
Years Ended December 31,
2010 2009 2008 2007 2006
EARNINGS:
Income (loss) before income taxes $ 2,264 $ (1,728) $ (4,591) $ 4,005 $ 3,602
Less: Undistributed earnings from limited partnerships and other
alternative investments 60 (380) (539) 93 58
Add: Total fixed charges, before interest credited to contractholders 566 537 413 332 354
Total earnings, before interest credited to contractholders 2,770 (811) (3,639) 4,244 3,898
Interest credited to contractholders [1] 763 4,947 (8,533) 2,022 3,553
Total earnings $ 3,533 $ 4,136 $ (12,172) $ 6,266 $ 7,451
FIXED CHARGES:
Interest expense $ 508 $ 476 $ 343 $ 263 $ 277
Interest factor attributable to rentals and other [2] 58 61 70 69 77
Total fixed charges, before interest credited to contractholders 566 537 413 332 354
Interest credited to contractholders [1] 763 4,947 (8,533) 2,022 3,553
Total fixed charges 1,329 5,484 (8,120) 2,354 3,907
Preferred stock dividend requirements [3] 694 249 13 — —
Total fixed charges and preferred stock dividend requirements,
before interest credited to contractholders 1,260 786 42
6
332 354
Total fixed charges and preferred stock dividend requirements $ 2,023 $ 5,733 $ (8,107) $ 2,354 $ 3,907
RATIOS:
Total earnings to total fixed charges [4] 2.7 NM NM 2.7 1.9
Total earnings to total fixed charges and preferred stock dividend
requirements [4] 1.7 NM NM 2.7 1.9
Deficiency of total earnings to total fixed charges [5] $ — $ 1,348 $ 4,052 $ — $ —
Deficiency of total earnings to total fixed charges and preferred stock
dividend requirements [5] $ — $ 1,597 $ 4,065 $ — $ —
Ratios before interest credited to contractholders [6]
Total earnings to total fixed charges [4] 4.9 NM NM 12.8 11.0
Total earnings to total fixed charges and preferred stock dividend
requirements [4] 2.2 NM NM 12.8 11.0
[1] Interest credited to contractholders includes interest credited on general account assets and interest credited on consumer notes. For the year
ended December 31, 2008, the $(8.5) billion in interest credited to contractholders was primarily due to $(10.3) billion in investment income
losses and mark-to-market effects of equity securities, trading, supporting the international variable annuity business.
[2] Interest factor attributable to rental and others includes 1/3 of total rent expense as disclosed in the notes to the financial statements, capitalized
interest and amortization of debt issuance costs.
[3] Preferred stock dividend requirements include preferred stock dividends accrued and accretion of discount on preferred stock issuance.
[4] Ratios of less than one-to-one are presented as “NM” or not meaningful.
[5] Represents additional earnings that would be necessary to result in a one-to-one ratio. These amounts are primarily due to before-tax realized
losses of $(2.0) billion and $(5.9) billion, which includes before-tax impairments of $(1.5) billion and $(4.0) billion, for the years ended December
31, 2009 and 2008, respectively.
[6] These secondary ratios are disclosed for the convenience of fixed income investors and the rating agencies that serve them and are more
comparable to the ratios disclosed by all issuers of fixed income securities.