The Hartford 2010 Annual Report Download - page 146
Download and view the complete annual report
Please find page 146 of the 2010 The Hartford annual report below. You can navigate through the pages in the report by either clicking on the pages listed below, or by using the keyword search tool below to find specific information within the annual report.-
 1
1 -
2
-
3
-
4
-
5
-
6
-
7
-
8
-
9
-
10
-
11
-
12
-
13
-
14
-
15
-
16
-
17
-
18
-
19
-
20
-
21
-
22
-
23
-
24
-
25
-
26
-
27
-
28
-
29
-
30
-
31
-
32
-
33
-
34
-
35
-
36
-
37
-
38
-
39
-
40
-
41
-
42
-
43
-
44
-
45
-
46
-
47
-
48
-
49
-
50
-
51
-
52
-
53
-
54
-
55
-
56
-
57
-
58
-
59
-
60
-
61
-
62
-
63
-
64
-
65
-
66
-
67
-
68
-
69
-
70
-
71
-
72
-
73
-
74
-
75
-
76
-
77
-
78
-
79
-
80
-
81
-
82
-
83
-
84
-
85
-
86
-
87
-
88
-
89
-
90
-
91
-
92
-
93
-
94
-
95
-
96
-
97
-
98
-
99
-
100
-
101
-
102
-
103
-
104
-
105
-
106
-
107
-
108
-
109
-
110
-
111
-
112
-
113
-
114
-
115
-
116
-
117
-
118
-
119
-
120
-
121
-
122
-
123
-
124
-
125
-
126
-
127
-
128
-
129
-
130
-
131
-
132
-
133
-
134
-
135
-
 136
136 -
 137
137 -
 138
138 -
 139
139 -
 140
140 -
 141
141 -
 142
142 -
 143
143 -
 144
144 -
 145
145 -
 146
146 -
 147
147 -
 148
148 -
 149
149 -
 150
150 -
 151
151 -
 152
152 -
 153
153 -
 154
154 -
 155
155 -
 156
156 -
157
-
158
-
159
-
160
-
161
-
162
-
163
-
164
-
165
-
166
-
167
-
168
-
169
-
170
-
171
-
172
-
173
-
174
-
175
-
176
-
177
-
178
-
179
-
180
-
181
-
182
-
183
-
184
-
185
-
186
-
187
-
188
-
189
-
190
-
191
-
192
-
193
-
194
-
195
-
196
-
197
-
198
-
199
-
200
-
201
-
202
-
203
-
204
-
205
-
206
-
207
-
208
-
209
-
210
-
211
-
212
-
213
-
214
-
215
-
216
-
217
-
218
-
219
-
220
-
221
-
222
-
223
-
224
-
225
-
226
-
227
-
228
-
229
-
230
-
231
-
232
-
233
-
234
-
235
-
236
-
237
-
238
-
239
-
240
-
241
-
242
-
243
-
244
-
245
-
246
-
247
-
248
 |
 |

THE HARTFORD FINANCIAL SERVICES GROUP, INC.
NOTES TO CONSOLIDATED FINANCIAL STATEMENTS (continued)
F-18
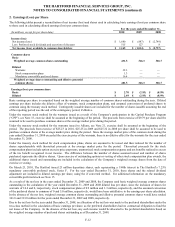
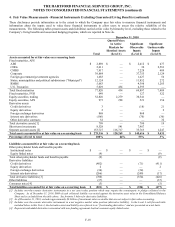
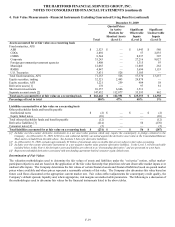
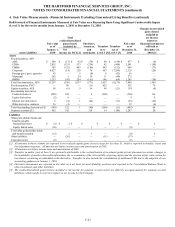
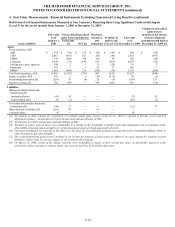
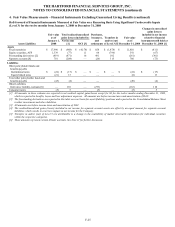
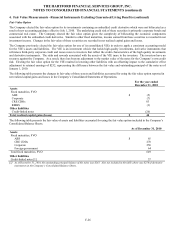
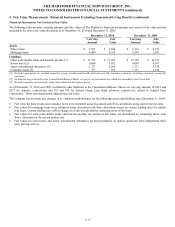
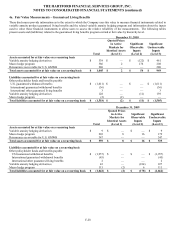
4. Fair Value Measurements –Financial Instruments Excluding Guaranteed Living Benefits (continued)
These disclosures provide information as to the extent to which the Company uses fair value to measure financial instruments and
information about the inputs used to value those financial instruments to allow users to assess the relative reliability of the
measurements. The following tables present assets and (liabilities) carried at fair value by hierarchy level, excluding those related to the
Company’ s living benefits and associated hedging programs, which are reported in Note 4a.
December 31, 2010
Total
Quoted Prices
in Active
Markets for
Identical Assets
(Level 1)
Significant
Observable
Inputs
(Level 2)
Significant
Unobservable
Inputs
(Level 3)
Assets accounted for at fair value on a recurring basis
Fixed maturities, AFS
ABS $ 2,889 $ — $ 2,412 $ 477
CDOs 2,611 — 30 2,581
CMBS 7,917 — 7,228 689
Corporate 39,884 — 37,755 2,129
Foreign government/government agencies 1,683 — 1,627 56
States, municipalities and political subdivisions (“Municipal”) 12,124 — 11,852 272
RMBS 5,683 — 4,398 1,285
U.S. Treasuries 5,029 434 4,595 —
Total fixed maturities 77,820 434 69,897 7,489
Fixed maturities, FVO 649 — 127 522
Equity securities, trading 32,820 2,279 30,541 —
Equity securities, AFS 973 298 521 154
Derivative assets
Credit derivatives 3 — (18) 21
Equity derivatives 2 — — 2
Foreign exchange derivatives 868 — 868 —
Interest rate derivatives (106) — (70) (36)
Other derivative contracts 32 — — 32
Total derivative assets [1] 799 — 780 19
Short-term investments 8,528 541 7,987 —
Separate account assets [2] 153,727 116,717 35,763 1,247
Total assets accounted for at fair value on a recurring basis $ 275,316 $ 120,269 $ 145,616 $ 9,431
Percentage of level to total 100% 44% 53% 3%
Liabilities accounted for at fair value on a recurring basis
Other policyholder funds and benefits payable
Institutional notes $ — $ — $ — $ —
Equity linked notes (9) — — (9)
Total other policyholder funds and benefits payable (9) (9)
Derivative liabilities
Credit derivatives (482) — (71) (411)
Equity derivatives 2 — — 2
Foreign exchange derivatives (34) — (34) —
Interest rate derivatives (266) — (249) (17)
Total derivative liabilities [3] (780) — (354) (426)
Other liabilities (37) — — (37)
Consumer notes [4] (5) — — (5)
Total liabilities accounted for at fair value on a recurring basis $ (831) $ — $ (354) $ (477)
[1] Includes over-the-counter derivative instruments in a net asset value position which may require the counterparty to pledge collateral to the
Company. As of December 31, 2010, $968 of cash collateral liability was netted against the derivative asset value in the Consolidated Balance
Sheet and is excluded from the table above. See footnote 3 below for derivative liabilities.
[2] As of December 31, 2010, excludes approximately $6 billion of investment sales receivable that are not subject to fair value accounting.
[3] Includes over-the-counter derivative instruments in a net negative market value position (derivative liability). In the Level 3 roll-forward table
included below in this Note 4, the derivative asset and liability are referred to as “freestanding derivatives” and are presented on a net basis.
[4] Represents embedded derivatives associated with non-funding agreement-backed consumer equity linked notes.