Lenovo 2014 Annual Report Download - page 85
Download and view the complete annual report
Please find page 85 of the 2014 Lenovo annual report below. You can navigate through the pages in the report by either clicking on the pages listed below, or by using the keyword search tool below to find specific information within the annual report.-
 1
1 -
2
-
3
-
4
-
5
-
6
-
7
-
8
-
9
-
10
-
11
-
12
-
13
-
14
-
15
-
16
-
17
-
18
-
19
-
20
-
21
-
22
-
23
-
24
-
25
-
26
-
27
-
28
-
29
-
30
-
31
-
32
-
33
-
34
-
35
-
36
-
37
-
38
-
39
-
40
-
41
-
42
-
43
-
44
-
45
-
46
-
47
-
48
-
49
-
50
-
51
-
52
-
53
-
54
-
55
-
56
-
57
-
58
-
59
-
60
-
61
-
62
-
63
-
64
-
65
-
66
-
67
-
68
-
69
-
70
-
71
-
72
-
73
-
74
-
 75
75 -
 76
76 -
 77
77 -
 78
78 -
 79
79 -
 80
80 -
 81
81 -
 82
82 -
 83
83 -
 84
84 -
 85
85 -
 86
86 -
 87
87 -
 88
88 -
 89
89 -
 90
90 -
 91
91 -
 92
92 -
 93
93 -
 94
94 -
 95
95 -
96
-
97
-
98
-
99
-
100
-
101
-
102
-
103
-
104
-
105
-
106
-
107
-
108
-
109
-
110
-
111
-
112
-
113
-
114
-
115
-
116
-
117
-
118
-
119
-
120
-
121
-
122
-
123
-
124
-
125
-
126
-
127
-
128
-
129
-
130
-
131
-
132
-
133
-
134
-
135
-
136
-
137
-
138
-
139
-
140
-
141
-
142
-
143
-
144
-
145
-
146
-
147
-
148
-
149
-
150
-
151
-
152
-
153
-
154
-
155
-
156
-
157
-
158
-
159
-
160
-
161
-
162
-
163
-
164
-
165
-
166
-
167
-
168
-
169
-
170
-
171
-
172
-
173
-
174
-
175
-
176
-
177
-
178
-
179
-
180
-
181
-
182
-
183
-
184
-
185
-
186
-
187
-
188
-
189
-
190
-
191
-
192
-
193
-
194
-
195
-
196
-
197
-
198
-
199
 |
 |

83
2013/14 Annual Report Lenovo Group Limited
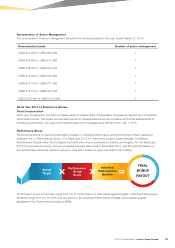
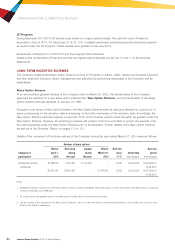
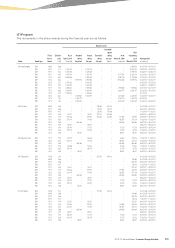
LTI Program
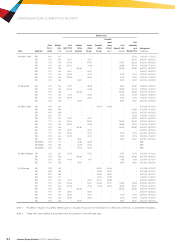
The movements in the share awards during the financial year are as follows:
Number of units
Name Award type
Fiscal
Year of
Award
Effective
price
(HK$)
As at
April 1, 2013
(Unvested)
Awarded
during
the period
Vested
during
the year
Exercised
during
the year
Cancelled/
lapsed
during
the year
(Note 2)
As at
March 31, 2014
(unvested)
Total
outstanding
as at
March 31, 2014
Vesting period
(mm.dd.yyyy)
Mr. Yang Yuanqing SAR 08/09 5.88 – – – – – – 3,939,855 06.01.2009 – 06.01.2012
SAR 09/10 3.17 5,700,000 –5,700,000 – – – 22,800,000 05.25.2010 – 05.25.2013
SAR 09/10 5.23 1,649,039 –1,649,039 – – – 6,596,156 02.08.2011 – 02.08.2014
SAR 10/11 4.92 5,515,109 –2,757,555 – – 2,757,554 11,030,219 02.21.2012 – 02.21.2015
SAR 11/12 6.80 8,349,268 –2,783,090 – – 5,566,178 11,132,358 02.13.2013 – 02.13.2016
SAR 12/13 8.22 –14,059,573 3,514,893 – – 10,544,680 14,059,573 02.04.2014 – 02.04.2017
RSU 09/10 3.17 2,550,000 –2,550,000 – – – – 05.25.2010 – 05.25.2013
RSU 09/10 5.23 1,236,780 –1,236,780 – – – – 02.08.2011 – 02.08.2014
RSU 10/11 4.92 3,939,364 –1,969,682 – – 1,969,682 1,969,682 02.21.2012 – 02.21.2015
RSU 11/12 6.80 5,009,561 –1,669,854 – – 3,339,707 3,339,707 02.13.2013 – 02.13.2016
RSU 12/13 6.75 1,730,230 –1,730,230 – – – – 06.01.2013
RSU 12/13 8.22 –5,699,827 1,424,957 – – 4,274,870 4,274,870 02.04.2014 – 02.04.2017
RSU 12/13 7.82 –2,164,779 – – – 2,164,779 2,164,779 06.03.2014
RSU 12/13 7.82 –3,216,329 – – – 3,216,329 3,216,329 06.03.2014 – 06.03.2016
Mr. Zhu Linan SAR 08/09 5.88 – – – 195,980 132,456 – – 06.01.2009 – 06.01.2011
SAR 09/10 3.88 – – – 87,932 39,216 – – 08.07.2010 – 08.07.2012
SAR 09/10 4.47 – – – 38,163 19,608 – – 11.30.2010 – 11.30.2012
SAR 10/11 4.59 79,001 –79,001 237,001 125,038 – – 08.20.2011 – 08.20.2013
SAR 11/12 4.56 215,333 –107,667 215,334 112,865 107,666 107,666 08.19.2012 – 08.19.2014
SAR 12/13 6.36 274,316 –91,439 – – 182,877 274,316 07.03.2013 – 07.03.2015
SAR 13/14 7.88 –364,084 – – – 364,084 364,084 08.16.2014 – 08.16.2016
RSU 10/11 4.59 39,501 –39,501 – – – – 08.20.2011 – 08.20.2013
RSU 11/12 4.56 102,540 –51,270 – – 51,270 51,270 08.19.2012 – 08.19.2014
RSU 12/13 6.36 109,729 –36,576 – – 73,153 73,153 07.03.2013 – 07.03.2015
RSU 13/14 7.88 –98,401 – – – 98,401 98,401 08.16.2014 – 08.16.2016
Mr. Zhao John Huan SAR 11/12 5.78 69,275 –34,638 – – 34,637 103,913 11.03.2012 – 11.03.2014
SAR 12/13 6.36 274,316 –91,439 – – 182,877 274,316 07.03.2013 – 07.03.2015
SAR 13/14 7.88 –364,084 – – – 364,084 364,084 08.16.2014 – 08.16.2016
RSU 11/12 5.78 32,988 –16,494 – – 16,494 16,494 11.03.2012 – 11.03.2014
RSU 12/13 6.36 109,729 –36,576 – – 73,153 73,153 07.03.2013 – 07.03.2015
RSU 13/14 7.88 –98,401 – – – 98,401 98,401 08.16.2014 – 08.16.2016
Mr. Ting Lee Sen SAR 07/08 3.94 – – – 297,000 139,142 – – 06.01.2008 – 06.01.2010
SAR 08/09 5.88 – – – – – – 195,980 06.01.2009 – 06.01.2011
SAR 09/10 3.88 – – – – – – 263,796 08.07.2010 – 08.07.2012
SAR 09/10 4.47 – – – – – – 38,163 11.30.2010 – 11.30.2012
SAR 10/11 4.59 79,001 –79,001 – – – 237,001 08.20.2011 – 08.20.2013
SAR 11/12 4.56 215,333 –107,667 – – 107,666 323,000 08.19.2012 – 08.19.2014
SAR 12/13 6.36 274,316 –91,439 – – 182,877 274,316 07.03.2013 – 07.03.2015
SAR 13/14 7.88 –364,084 – – – 364,084 364,084 08.16.2014 – 08.16.2016
RSU 10/11 4.59 39,501 –39,501 – – – – 08.20.2011 – 08.20.2013
RSU 11/12 4.56 102,540 –51,270 – – 51,270 51,270 08.19.2012 – 08.19.2014
RSU 12/13 6.36 109,729 –36,576 – – 73,153 73,153 07.03.2013 – 07.03.2015
RSU 13/14 7.88 –98,401 – – – 98,401 98,401 08.16.2014 – 08.16.2016
Dr. Tian Suning SAR 07/08 5.14 – – – 151,950 89,516 – – 09.01.2008 – 09.01.2010
SAR 08/09 5.88 – – – – – – 195,980 06.01.2009 – 06.01.2011
SAR 09/10 3.88 – – – – – – 263,796 08.07.2010 – 08.07.2012
SAR 09/10 4.47 – – – – – – 38,163 11.30.2010 – 11.30.2012
SAR 10/11 4.59 79,001 –79,001 – – – 237,001 08.20.2011 – 08.20.2013
SAR 11/12 4.56 215,333 –107,667 – – 107,666 323,000 08.19.2012 – 08.19.2014
SAR 12/13 6.36 274,316 –91,439 – – 182,877 274,316 07.03.2013 – 07.03.2015
SAR 13/14 7.88 –364,084 – – – 364,084 364,084 08.16.2014 – 08.16.2016
RSU 10/11 4.59 39,501 –39,501 – – – – 08.20.2011 – 08.20.2013
RSU 11/12 4.56 102,540 –51,270 – – 51,270 51,270 08.19.2012 – 08.19.2014
RSU 12/13 6.36 109,729 –36,576 – – 73,153 73,153 07.03.2013 – 07.03.2015
RSU 13/14 7.88 –98,401 – – – 98,401 98,401 08.16.2014 – 08.16.2016