Lenovo 2014 Annual Report Download - page 157
Download and view the complete annual report
Please find page 157 of the 2014 Lenovo annual report below. You can navigate through the pages in the report by either clicking on the pages listed below, or by using the keyword search tool below to find specific information within the annual report.-
 1
1 -
2
-
3
-
4
-
5
-
6
-
7
-
8
-
9
-
10
-
11
-
12
-
13
-
14
-
15
-
16
-
17
-
18
-
19
-
20
-
21
-
22
-
23
-
24
-
25
-
26
-
27
-
28
-
29
-
30
-
31
-
32
-
33
-
34
-
35
-
36
-
37
-
38
-
39
-
40
-
41
-
42
-
43
-
44
-
45
-
46
-
47
-
48
-
49
-
50
-
51
-
52
-
53
-
54
-
55
-
56
-
57
-
58
-
59
-
60
-
61
-
62
-
63
-
64
-
65
-
66
-
67
-
68
-
69
-
70
-
71
-
72
-
73
-
74
-
75
-
76
-
77
-
78
-
79
-
80
-
81
-
82
-
83
-
84
-
85
-
86
-
87
-
88
-
89
-
90
-
91
-
92
-
93
-
94
-
95
-
96
-
97
-
98
-
99
-
100
-
101
-
102
-
103
-
104
-
105
-
106
-
107
-
108
-
109
-
110
-
111
-
112
-
113
-
114
-
115
-
116
-
117
-
118
-
119
-
120
-
121
-
122
-
123
-
124
-
125
-
126
-
127
-
128
-
129
-
130
-
131
-
132
-
133
-
134
-
135
-
136
-
137
-
138
-
139
-
140
-
141
-
142
-
143
-
144
-
145
-
146
-
 147
147 -
 148
148 -
 149
149 -
 150
150 -
 151
151 -
 152
152 -
 153
153 -
 154
154 -
 155
155 -
 156
156 -
 157
157 -
 158
158 -
 159
159 -
 160
160 -
 161
161 -
 162
162 -
 163
163 -
 164
164 -
 165
165 -
 166
166 -
 167
167 -
168
-
169
-
170
-
171
-
172
-
173
-
174
-
175
-
176
-
177
-
178
-
179
-
180
-
181
-
182
-
183
-
184
-
185
-
186
-
187
-
188
-
189
-
190
-
191
-
192
-
193
-
194
-
195
-
196
-
197
-
198
-
199
 |
 |
155
2013/14 Annual Report Lenovo Group Limited
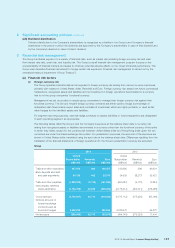
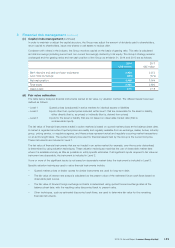
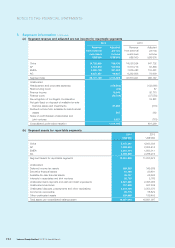
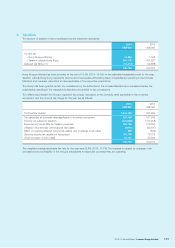
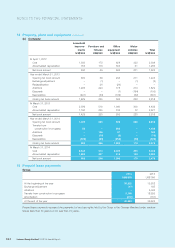
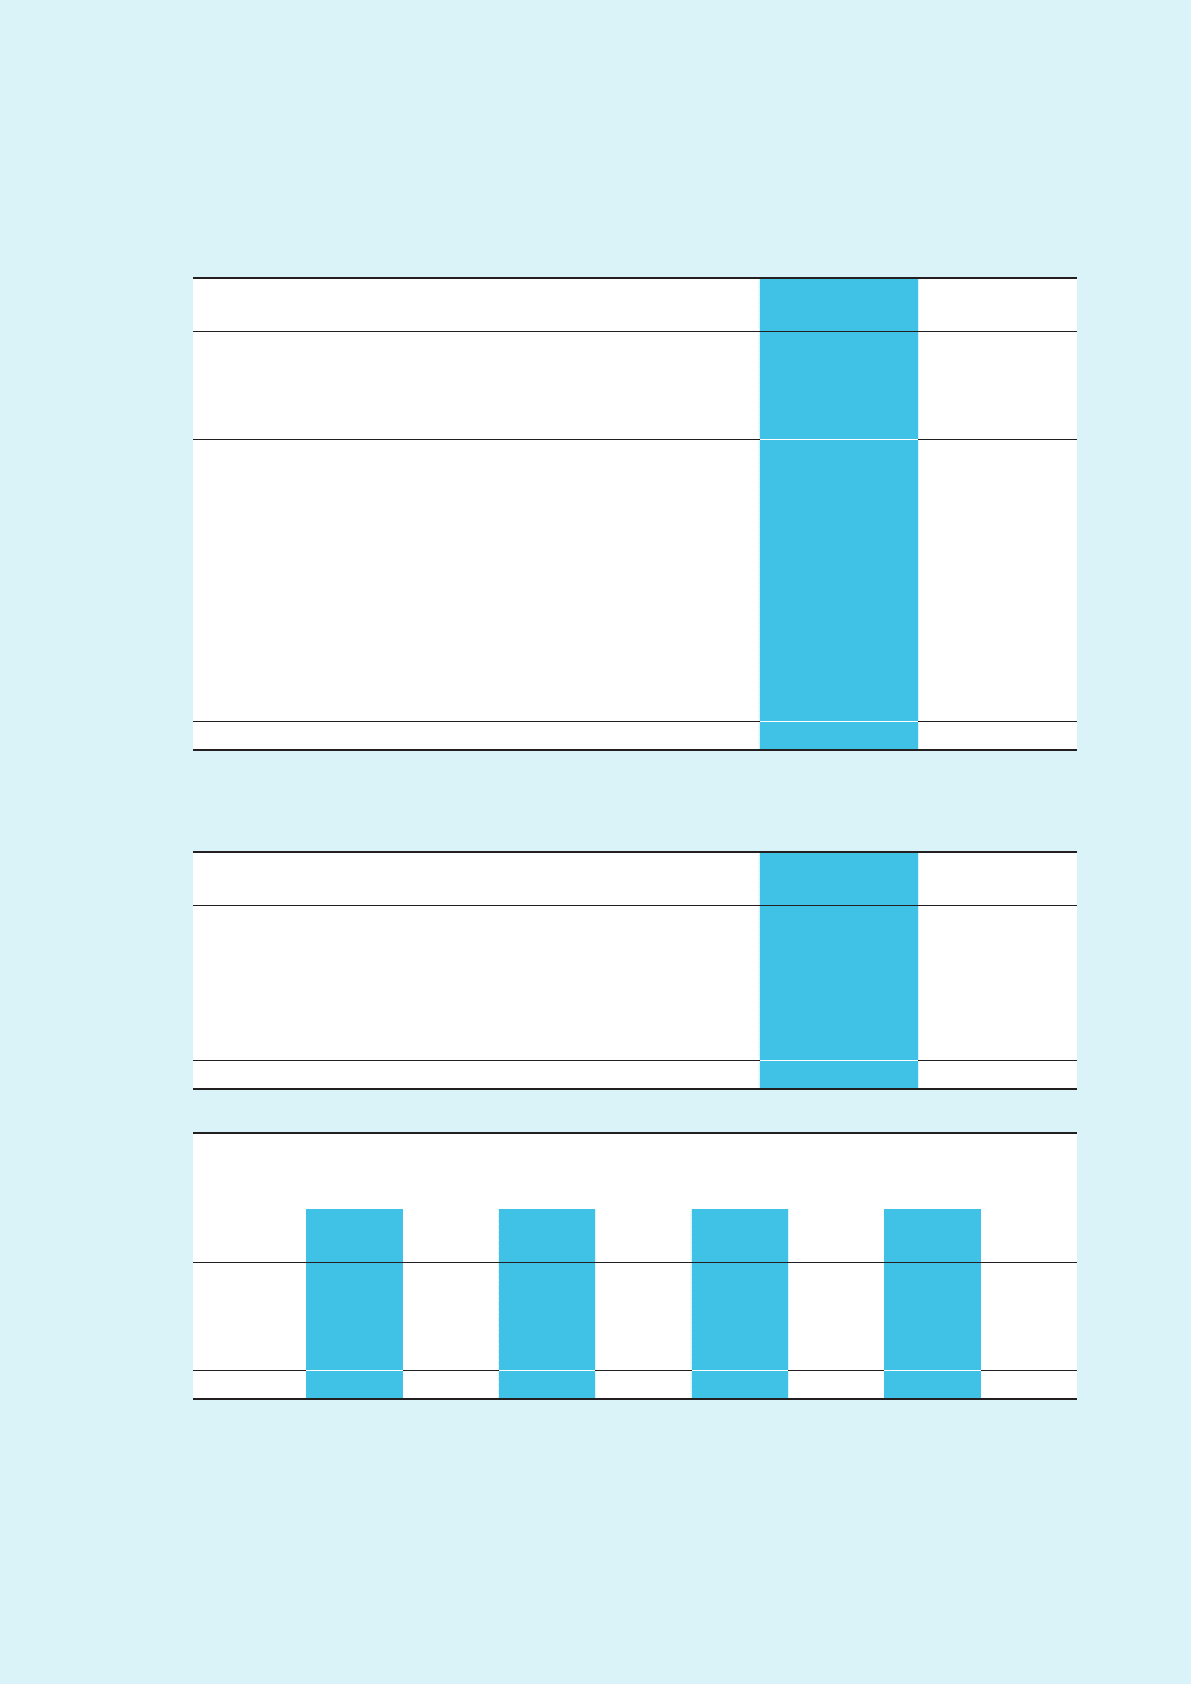
5 Segment information (continued)
(c) Segment liabilities for reportable segments
2014 2013
US$’000 US$’000
China 3,965,295 4,324,261
AP 1,671,669 1,548,694
EMEA 1,407,530 1,115,554
AG 1,636,349 1,495,433
Segment liabilities for reportable segments 8,680,843 8,483,942
Unallocated:
Income tax payable 177,741 100,179
Deferred income tax liabilities 142,881 113,992
Derivative financial liabilities 58,462 69,053
Unallocated bank borrowings 300,000 300,000
Unallocated trade payables 2,862,851 1,979,026
Unallocated other payables and accruals 2,687,703 2,750,353
Unallocated provisions 16,522 35,045
Unallocated other non-current liabilities 308,889 284,982
Other unallocated liabilities 96,481 85,244
Total liabilities per consolidated balance sheet 15,332,373 14,201,816
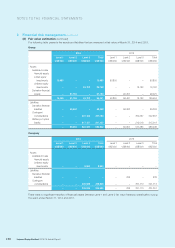
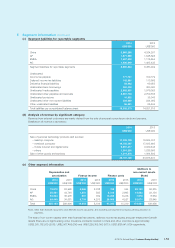
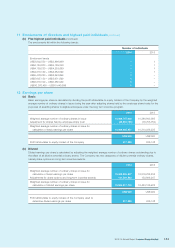
(d) Analysis of revenue by significant category
Revenue from external customers are mainly derived from the sale of personal computer products and services.
Breakdown of revenue is as follows:
2014 2013
US$’000 US$’000
Sale of personal technology products and services
– desktop computer 11,039,139 10,524,707
– notebook computer 19,705,097 17,935,693
– mobile internet and digital home 5,657,417 3,039,443
– others 1,091,200 1,288,666
Sale of other goods and services 1,214,276 1,084,892
38,707,129 33,873,401
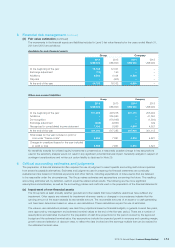
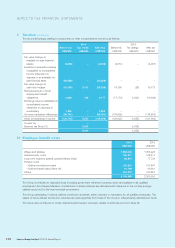
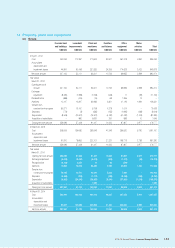
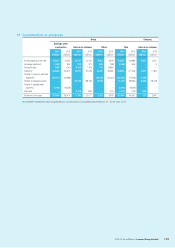
(e) Other segment information
Depreciation and
amortization Finance income Finance costs
Additions to
non-current assets
(Note)
2014 2013 2014 2013 2014 2013 2014 2013
US$’000 US$’000 US$’000 US$’000 US$’000 US$’000 US$’000 US$’000
China 79,970 93,999 3,966 2,738 788 344 99,190 66,235
AP 55,481 44,746 1,251 383 6,318 3,963 14,822 23,154
EMEA 50,234 36,278 697 709 10,206 6,476 7,978 8,664
AG 69,448 34,581 8,739 4,276 29,908 4,527 52,071 28,945
Total 255,133 209,604 14,653 8,106 47,220 15,310 174,061 126,998
Note: Other than financial instruments and deferred income tax assets; and excluding construction-in-progress pending allocation to
segments.
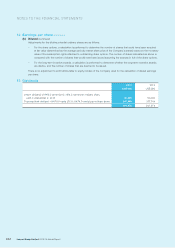
The total of non-current assets other than financial instruments, deferred income tax assets and post-employment benefit
assets (there are no rights arising under insurance contracts) located in China and other countries is approximately
US$2,305,752,000 (2013: US$2,067,456,000) and US$2,226,306,000 (2013: US$1,988,441,000) respectively.