Lenovo 2014 Annual Report Download - page 148
Download and view the complete annual report
Please find page 148 of the 2014 Lenovo annual report below. You can navigate through the pages in the report by either clicking on the pages listed below, or by using the keyword search tool below to find specific information within the annual report.-
 1
1 -
2
-
3
-
4
-
5
-
6
-
7
-
8
-
9
-
10
-
11
-
12
-
13
-
14
-
15
-
16
-
17
-
18
-
19
-
20
-
21
-
22
-
23
-
24
-
25
-
26
-
27
-
28
-
29
-
30
-
31
-
32
-
33
-
34
-
35
-
36
-
37
-
38
-
39
-
40
-
41
-
42
-
43
-
44
-
45
-
46
-
47
-
48
-
49
-
50
-
51
-
52
-
53
-
54
-
55
-
56
-
57
-
58
-
59
-
60
-
61
-
62
-
63
-
64
-
65
-
66
-
67
-
68
-
69
-
70
-
71
-
72
-
73
-
74
-
75
-
76
-
77
-
78
-
79
-
80
-
81
-
82
-
83
-
84
-
85
-
86
-
87
-
88
-
89
-
90
-
91
-
92
-
93
-
94
-
95
-
96
-
97
-
98
-
99
-
100
-
101
-
102
-
103
-
104
-
105
-
106
-
107
-
108
-
109
-
110
-
111
-
112
-
113
-
114
-
115
-
116
-
117
-
118
-
119
-
120
-
121
-
122
-
123
-
124
-
125
-
126
-
127
-
128
-
129
-
130
-
131
-
132
-
133
-
134
-
135
-
136
-
137
-
 138
138 -
 139
139 -
 140
140 -
 141
141 -
 142
142 -
 143
143 -
 144
144 -
 145
145 -
 146
146 -
 147
147 -
 148
148 -
 149
149 -
 150
150 -
 151
151 -
 152
152 -
 153
153 -
 154
154 -
 155
155 -
 156
156 -
 157
157 -
 158
158 -
159
-
160
-
161
-
162
-
163
-
164
-
165
-
166
-
167
-
168
-
169
-
170
-
171
-
172
-
173
-
174
-
175
-
176
-
177
-
178
-
179
-
180
-
181
-
182
-
183
-
184
-
185
-
186
-
187
-
188
-
189
-
190
-
191
-
192
-
193
-
194
-
195
-
196
-
197
-
198
-
199
 |
 |

146 Lenovo Group Limited 2013/14 Annual Report
NOTES TO THE FINANCIAL STATEMENTS
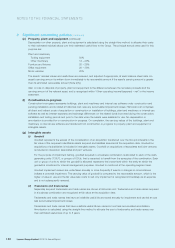
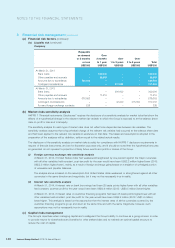
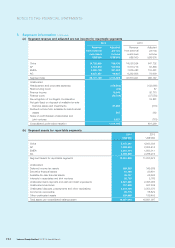
3 Financial risk management (continued)
(a) Financial risk factors (continued)
(i) Foreign currency risk (continued)
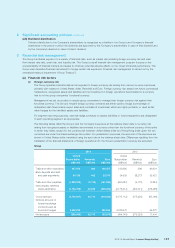
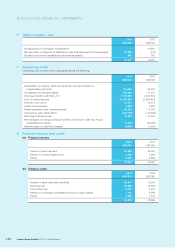
Company
2014 2013
Renminbi Euro Renminbi Euro
US$’000 US$’000 US$’000 US$’000
Other receivables – 1 – 1
Bank deposits and cash and
cash equivalents – 2 –40
Other payables – – (16) –
Amounts due from subsidiaries 212 –222 –
Amounts due to subsidiaries (139) (177) (139) (164)
Net exposure 73 (174) 67 (123)
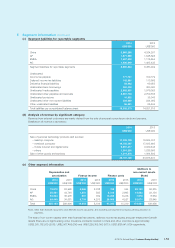
(ii) Cash flow interest rate risk
The Group’s interest rate risk mainly arises from long-term borrowings denominated in United States dollar. It is
the Group’s policy to mitigate interest rate risk through the use of appropriate interest rate hedging instruments.
Generally, the Group manages its cash flow interest rate risk by using floating-to-fixed interest rate swaps. Such
interest rate swaps have the economic effect of converting borrowings from floating rates to fixed rates. Under the
interest rate swaps, the Group agrees with other parties to exchange, at specified intervals (primarily quarterly), the
difference between fixed contract rates and floating-rate interest amounts calculated by reference to the agreed
notional amounts.
The Group operates various customer financing programs. The Group is exposed to fluctuation of interest rates of all
the currencies covered by those programs.
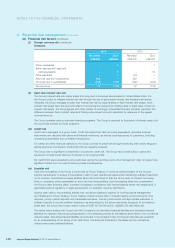
(iii) Credit risk
Credit risk is managed on a group basis. Credit risk arises from cash and cash equivalents, derivative financial
instruments and deposits with banks and financial institutions, as well as credit exposures to customers, including
outstanding receivables and committed transactions.
For banks and other financial institutions, the Group controls its credit risk through monitoring their credit rating and
setting approved counterparty credit limits that are regularly reviewed.
The Group has no significant concentration of customer credit risk. The Group has a credit policy in place and
exposures to these credit risks are monitored on an ongoing basis.
No credit limits were exceeded by any customers during the reporting period, and management does not expect any
significant losses from non-performance by these counterparties.
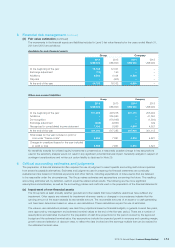
(iv) Liquidity risk
Cash flow forecasting of the Group is performed by Group Treasury. It monitors rolling forecasts of the Group’s
liquidity requirements to ensure it has sufficient cash to meet operational needs while maintaining sufficient headroom
on its undrawn committed borrowing facilities (Note 28) at all times so that the Group does not breach borrowing
limits or covenants (where applicable) on any of its borrowing facilities. Such forecasting takes into consideration
the Group’s debt financing plans, covenant compliance, compliance with internal balance sheet ratio targets and, if
applicable external regulatory or legal requirements, for example, currency restrictions.
Surplus cash held by the operating entities over and above balances required for working capital management
are transferred to Group Treasury. Group Treasury invests surplus cash in interest bearing current accounts, time
deposits, money market deposits and marketable securities, choosing instruments with appropriate maturities or
sufficient liquidity to provide sufficient headroom as determined by the above-mentioned forecasts, At the balance
sheet date, the Group held money market funds of US$719,704,000 (2013: US$846,272,000) (Note 25).
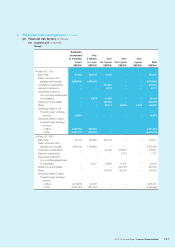
The tables below analyze the Group’s and the Company’s non-derivative financial liabilities and derivative financial
liabilities into relevant maturity groupings based on the remaining periods at the balance sheet date to the contractual
maturity dates. Derivative financial liabilities are included in the analysis if their contractual maturities are essential
for an understanding of the timing of the cash flows. The amounts disclosed in the tables are the contractual
undiscounted cash outflows/(inflows).