Lenovo 2014 Annual Report Download - page 170
Download and view the complete annual report
Please find page 170 of the 2014 Lenovo annual report below. You can navigate through the pages in the report by either clicking on the pages listed below, or by using the keyword search tool below to find specific information within the annual report.-
 1
1 -
2
-
3
-
4
-
5
-
6
-
7
-
8
-
9
-
10
-
11
-
12
-
13
-
14
-
15
-
16
-
17
-
18
-
19
-
20
-
21
-
22
-
23
-
24
-
25
-
26
-
27
-
28
-
29
-
30
-
31
-
32
-
33
-
34
-
35
-
36
-
37
-
38
-
39
-
40
-
41
-
42
-
43
-
44
-
45
-
46
-
47
-
48
-
49
-
50
-
51
-
52
-
53
-
54
-
55
-
56
-
57
-
58
-
59
-
60
-
61
-
62
-
63
-
64
-
65
-
66
-
67
-
68
-
69
-
70
-
71
-
72
-
73
-
74
-
75
-
76
-
77
-
78
-
79
-
80
-
81
-
82
-
83
-
84
-
85
-
86
-
87
-
88
-
89
-
90
-
91
-
92
-
93
-
94
-
95
-
96
-
97
-
98
-
99
-
100
-
101
-
102
-
103
-
104
-
105
-
106
-
107
-
108
-
109
-
110
-
111
-
112
-
113
-
114
-
115
-
116
-
117
-
118
-
119
-
120
-
121
-
122
-
123
-
124
-
125
-
126
-
127
-
128
-
129
-
130
-
131
-
132
-
133
-
134
-
135
-
136
-
137
-
138
-
139
-
140
-
141
-
142
-
143
-
144
-
145
-
146
-
147
-
148
-
149
-
150
-
151
-
152
-
153
-
154
-
155
-
156
-
157
-
158
-
159
-
 160
160 -
 161
161 -
 162
162 -
 163
163 -
 164
164 -
 165
165 -
 166
166 -
 167
167 -
 168
168 -
 169
169 -
 170
170 -
 171
171 -
 172
172 -
 173
173 -
 174
174 -
 175
175 -
 176
176 -
 177
177 -
 178
178 -
 179
179 -
 180
180 -
181
-
182
-
183
-
184
-
185
-
186
-
187
-
188
-
189
-
190
-
191
-
192
-
193
-
194
-
195
-
196
-
197
-
198
-
199
 |
 |
168 Lenovo Group Limited 2013/14 Annual Report
NOTES TO THE FINANCIAL STATEMENTS
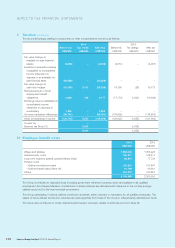
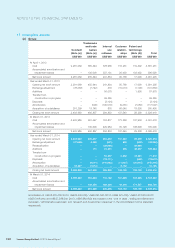
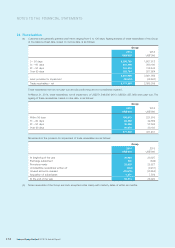
17 Intangible assets
(continued)
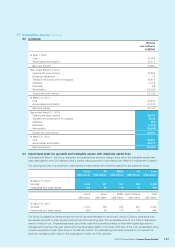
(c) Impairment tests for goodwill and intangible assets with indefinite useful lives (continued)
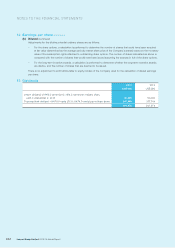
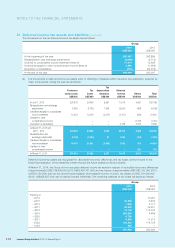
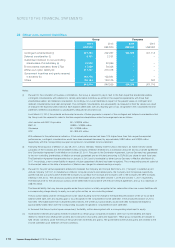
Future cash flows are discounted at the rate of 11% (2013: 11%) across all CGUs. The estimated compound annual
growth rates used for value-in-use calculations under the five-year financial budgets period are as follows:
2014 2013
China 2% 8%
APLA N/A -2%
EMEA -2% -1%
North America N/A 0%
AP -1% N/A
AG 0% N/A
Management determined budgeted gross margins based on past performance and its expectations for the market
development. The weighted average growth rates used are consistent with the forecasts included in industry reports. The
discount rates are pre-tax and reflect specific risks relating to the relevant segments.
The directors are of the view that there was no evidence of impairment of goodwill and trademarks and trade names as at
March 31, 2014 arising from the review (2013: Nil).
The Group has performed a sensitivity analysis on key assumptions used for the annual impairment test for goodwill.
Except for AP in 2014 and APLA in 2013, a reasonably possible change in key assumptions used in the impairment test
for goodwill would not cause any CGU’s carrying amount to exceed its respective recoverable amount. As at March 31,
2014, the recoverable amount for AP calculated based on value in use exceeded carrying value by US$578 million. Had
AP’s forecasted operating margin been 1.60 percentage point lower than management’s estimates, the AP’s remaining
headroom would be removed.
As at March 31, 2013, the recoverable amount for APLA calculated based on value in use exceeded carrying value by
US$409 million. Had APLA’s forecasted operating margin been 0.80 percentage point lower than management’s estimates,
the APLA’s remaining headroom would be removed.
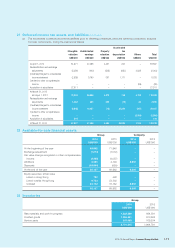
(d) At March 31, 2014, included in the patent and technology is a construction-in-progress balance of US$58,880,000 (2013:
Nil).
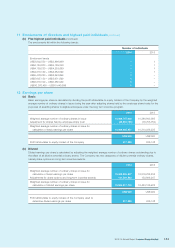
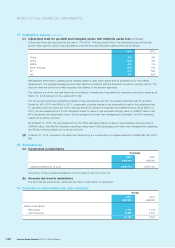
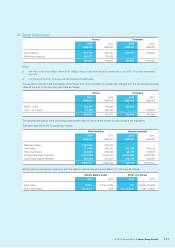
18 Subsidiaries
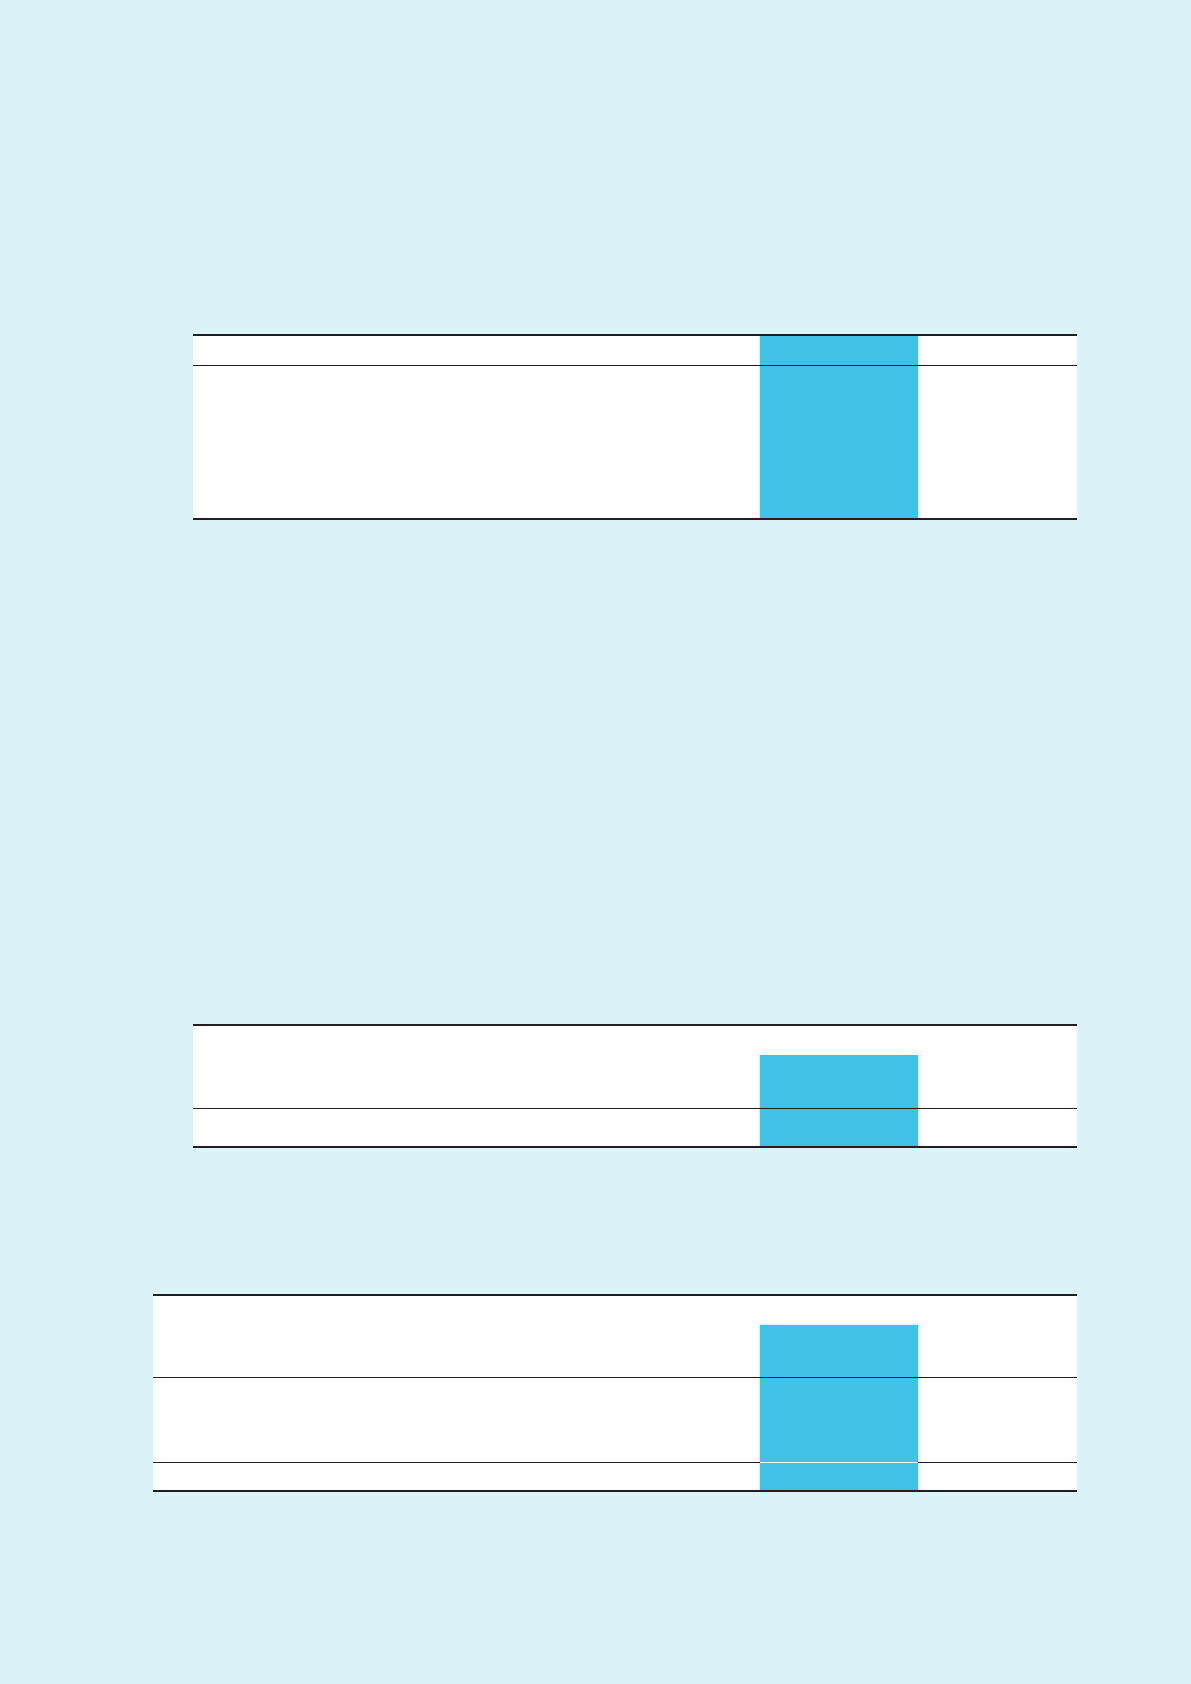
(a) Investments in subsidiaries
Company
2014 2013
US$’000 US$’000
Unlisted investments, at cost 2,888,712 2,807,103
A summary of the principal subsidiaries of the Company is set out in Note 38.
(b) Amounts due from/to subsidiaries
The amounts are interest-free, unsecured and have no fixed terms of repayment.
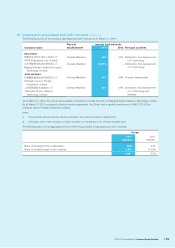
19 Interests in associates and joint ventures
Group
2014 2013
US$’000 US$’000
Share of net assets
– Associates 5,401 1,149
– Joint ventures 15,352 1,614
20,753 2,763