Lenovo 2014 Annual Report Download - page 149
Download and view the complete annual report
Please find page 149 of the 2014 Lenovo annual report below. You can navigate through the pages in the report by either clicking on the pages listed below, or by using the keyword search tool below to find specific information within the annual report.-
 1
1 -
2
-
3
-
4
-
5
-
6
-
7
-
8
-
9
-
10
-
11
-
12
-
13
-
14
-
15
-
16
-
17
-
18
-
19
-
20
-
21
-
22
-
23
-
24
-
25
-
26
-
27
-
28
-
29
-
30
-
31
-
32
-
33
-
34
-
35
-
36
-
37
-
38
-
39
-
40
-
41
-
42
-
43
-
44
-
45
-
46
-
47
-
48
-
49
-
50
-
51
-
52
-
53
-
54
-
55
-
56
-
57
-
58
-
59
-
60
-
61
-
62
-
63
-
64
-
65
-
66
-
67
-
68
-
69
-
70
-
71
-
72
-
73
-
74
-
75
-
76
-
77
-
78
-
79
-
80
-
81
-
82
-
83
-
84
-
85
-
86
-
87
-
88
-
89
-
90
-
91
-
92
-
93
-
94
-
95
-
96
-
97
-
98
-
99
-
100
-
101
-
102
-
103
-
104
-
105
-
106
-
107
-
108
-
109
-
110
-
111
-
112
-
113
-
114
-
115
-
116
-
117
-
118
-
119
-
120
-
121
-
122
-
123
-
124
-
125
-
126
-
127
-
128
-
129
-
130
-
131
-
132
-
133
-
134
-
135
-
136
-
137
-
138
-
 139
139 -
 140
140 -
 141
141 -
 142
142 -
 143
143 -
 144
144 -
 145
145 -
 146
146 -
 147
147 -
 148
148 -
 149
149 -
 150
150 -
 151
151 -
 152
152 -
 153
153 -
 154
154 -
 155
155 -
 156
156 -
 157
157 -
 158
158 -
 159
159 -
160
-
161
-
162
-
163
-
164
-
165
-
166
-
167
-
168
-
169
-
170
-
171
-
172
-
173
-
174
-
175
-
176
-
177
-
178
-
179
-
180
-
181
-
182
-
183
-
184
-
185
-
186
-
187
-
188
-
189
-
190
-
191
-
192
-
193
-
194
-
195
-
196
-
197
-
198
-
199
 |
 |

147
2013/14 Annual Report Lenovo Group Limited
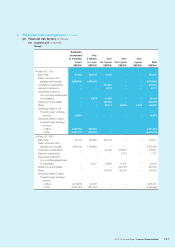
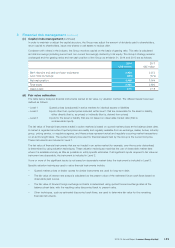
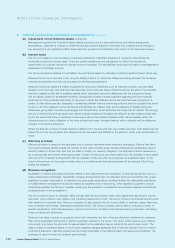
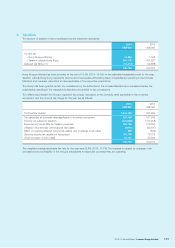
3 Financial risk management (continued)
(a) Financial risk factors (continued)
(iv) Liquidity risk (continued)
Group
Repayable
on demand
or 3 months
or less
Over
3 months
to 1 year
Over
1 to 3 years
Over
3 to 5 years
Over
5 years Total
US$’000 US$’000 US$’000 US$’000 US$’000 US$’000
At March 31, 2014
Bank loans 47,282 398,195 10,125 – – 455,602
Trade, notes and other
payables and accruals 8,688,816 1,065,166 – – – 9,753,982
Contingent considerations – – 318,251 – – 318,251
Deferred consideration – – 2,172 – – 2,172
Guaranteed dividend to
non-controlling shareholders
of a subsidiary –6,833 19,359 – – 26,192
Written put option liability – – 224,790 – – 224,790
Others – – 88,747 58,276 9,629 156,652
Derivatives settled in net:
Forward foreign exchange
contracts 19,941 – – – – 19,941
Derivatives settled in gross:
Forward foreign exchange
contracts
– outflow 5,245,168 226,392 – – – 5,471,560
– inflow (5,290,774) (229,500) –––(5,520,274)
At March 31, 2013
Bank loans 22,192 153,646 303,133 – – 478,971
Trade, notes and other
payables and accruals 7,636,708 1,115,520 – – – 8,752,228
Contingent considerations – – 42,000 276,251 –318,251
Deferred consideration – – – 2,172 –2,172
Guaranteed dividend to
non-controlling shareholders
of a subsidiary –6,347 12,695 11,637 –30,679
Written put option liability – – – 224,790 –224,790
Others – – 139,733 163,570 –303,303
Derivatives settled in gross:
Forward foreign exchange
contracts
– outflow 4,213,699 22,098 – – – 4,235,797
– inflow (4,241,612) (221,081) – – – (4,462,693)