Lenovo 2014 Annual Report Download - page 79
Download and view the complete annual report
Please find page 79 of the 2014 Lenovo annual report below. You can navigate through the pages in the report by either clicking on the pages listed below, or by using the keyword search tool below to find specific information within the annual report.-
 1
1 -
2
-
3
-
4
-
5
-
6
-
7
-
8
-
9
-
10
-
11
-
12
-
13
-
14
-
15
-
16
-
17
-
18
-
19
-
20
-
21
-
22
-
23
-
24
-
25
-
26
-
27
-
28
-
29
-
30
-
31
-
32
-
33
-
34
-
35
-
36
-
37
-
38
-
39
-
40
-
41
-
42
-
43
-
44
-
45
-
46
-
47
-
48
-
49
-
50
-
51
-
52
-
53
-
54
-
55
-
56
-
57
-
58
-
59
-
60
-
61
-
62
-
63
-
64
-
65
-
66
-
67
-
68
-
 69
69 -
 70
70 -
 71
71 -
 72
72 -
 73
73 -
 74
74 -
 75
75 -
 76
76 -
 77
77 -
 78
78 -
 79
79 -
 80
80 -
 81
81 -
 82
82 -
 83
83 -
 84
84 -
 85
85 -
 86
86 -
 87
87 -
 88
88 -
 89
89 -
90
-
91
-
92
-
93
-
94
-
95
-
96
-
97
-
98
-
99
-
100
-
101
-
102
-
103
-
104
-
105
-
106
-
107
-
108
-
109
-
110
-
111
-
112
-
113
-
114
-
115
-
116
-
117
-
118
-
119
-
120
-
121
-
122
-
123
-
124
-
125
-
126
-
127
-
128
-
129
-
130
-
131
-
132
-
133
-
134
-
135
-
136
-
137
-
138
-
139
-
140
-
141
-
142
-
143
-
144
-
145
-
146
-
147
-
148
-
149
-
150
-
151
-
152
-
153
-
154
-
155
-
156
-
157
-
158
-
159
-
160
-
161
-
162
-
163
-
164
-
165
-
166
-
167
-
168
-
169
-
170
-
171
-
172
-
173
-
174
-
175
-
176
-
177
-
178
-
179
-
180
-
181
-
182
-
183
-
184
-
185
-
186
-
187
-
188
-
189
-
190
-
191
-
192
-
193
-
194
-
195
-
196
-
197
-
198
-
199
 |
 |

77
2013/14 Annual Report Lenovo Group Limited
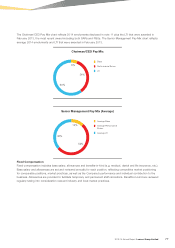
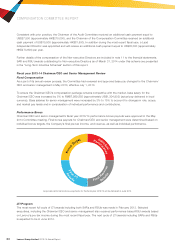
The Chairman/CEO Pay Mix chart reflects 2014 emoluments disclosed in note 11 plus the LTI that were awarded in
February 2013, the most recent award including both SARs and RSUs. The Senior Management Pay Mix chart reflects
average 2014 emoluments and LTI that were awarded in February 2013.
Chairman/CEO Pay Mix
Senior Management Pay Mix (Average)
Base
Performance Bonus
LTI
Average Base
Average Performance
Bonus
Average LTI
60%
34%
6%
36%
52%
12%
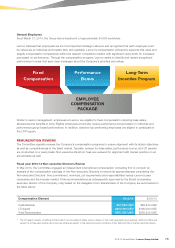
Fixed Compensation
Fixed compensation includes base salary, allowances and benefits-in-kind (e.g. medical, dental and life insurance, etc.).
Base salary and allowances are set and reviewed annually for each position, reflecting competitive market positioning
for comparable positions, market practices, as well as the Company’s performance and individual contribution to the
business. Allowances are provided to facilitate temporary and permanent staff relocations. Benefits-in-kind are reviewed
regularly taking into consideration relevant industry and local market practices.