Lenovo 2014 Annual Report Download - page 156
Download and view the complete annual report
Please find page 156 of the 2014 Lenovo annual report below. You can navigate through the pages in the report by either clicking on the pages listed below, or by using the keyword search tool below to find specific information within the annual report.-
 1
1 -
2
-
3
-
4
-
5
-
6
-
7
-
8
-
9
-
10
-
11
-
12
-
13
-
14
-
15
-
16
-
17
-
18
-
19
-
20
-
21
-
22
-
23
-
24
-
25
-
26
-
27
-
28
-
29
-
30
-
31
-
32
-
33
-
34
-
35
-
36
-
37
-
38
-
39
-
40
-
41
-
42
-
43
-
44
-
45
-
46
-
47
-
48
-
49
-
50
-
51
-
52
-
53
-
54
-
55
-
56
-
57
-
58
-
59
-
60
-
61
-
62
-
63
-
64
-
65
-
66
-
67
-
68
-
69
-
70
-
71
-
72
-
73
-
74
-
75
-
76
-
77
-
78
-
79
-
80
-
81
-
82
-
83
-
84
-
85
-
86
-
87
-
88
-
89
-
90
-
91
-
92
-
93
-
94
-
95
-
96
-
97
-
98
-
99
-
100
-
101
-
102
-
103
-
104
-
105
-
106
-
107
-
108
-
109
-
110
-
111
-
112
-
113
-
114
-
115
-
116
-
117
-
118
-
119
-
120
-
121
-
122
-
123
-
124
-
125
-
126
-
127
-
128
-
129
-
130
-
131
-
132
-
133
-
134
-
135
-
136
-
137
-
138
-
139
-
140
-
141
-
142
-
143
-
144
-
145
-
 146
146 -
 147
147 -
 148
148 -
 149
149 -
 150
150 -
 151
151 -
 152
152 -
 153
153 -
 154
154 -
 155
155 -
 156
156 -
 157
157 -
 158
158 -
 159
159 -
 160
160 -
 161
161 -
 162
162 -
 163
163 -
 164
164 -
 165
165 -
 166
166 -
167
-
168
-
169
-
170
-
171
-
172
-
173
-
174
-
175
-
176
-
177
-
178
-
179
-
180
-
181
-
182
-
183
-
184
-
185
-
186
-
187
-
188
-
189
-
190
-
191
-
192
-
193
-
194
-
195
-
196
-
197
-
198
-
199
 |
 |
154 Lenovo Group Limited 2013/14 Annual Report
NOTES TO THE FINANCIAL STATEMENTS
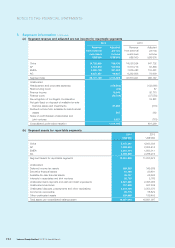
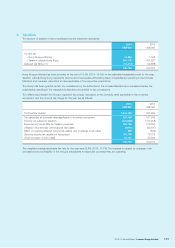
5 Segment information (continued)
(a) Segment revenue and adjusted pre-tax income for reportable segments
2014 2013
Revenue
from external
customers
Adjusted
pre-tax
income
Revenue
from external
customers
Adjusted
pre-tax
income
US$’000 US$’000 US$’000 US$’000
China 14,725,659 788,130 14,538,534 647,702
AP 6,162,919 109,350 5,516,776 62,865
EMEA 9,580,700 187,482 7,535,483 116,591
AG 8,237,851 68,627 6,282,608 78,609
Segment total 38,707,129 1,153,589 33,873,401 905,767
Unallocated:
Headquarters and corporate expenses (156,502) (132,960)
Restructuring costs (26) 87
Finance income 19,240 36,775
Finance costs (33,754) (27,559)
De-recognition of contingent consideration –19,861
Net gain/(loss) on disposal of available-for-sale
financial assets and investments 21,880 (316)
Dividend income from available-for-sale financial
assets 547 362
Share of profit/(losses) of associates and
joint ventures 9,221 (718)
Consolidated profit before taxation 1,014,195 801,299
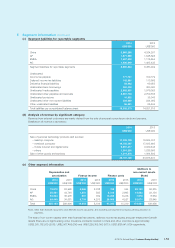
(b) Segment assets for reportable segments
2014 2013
US$’000 US$’000
China 5,157,241 4,943,934
AP 1,993,624 2,055,413
EMEA 2,341,114 1,933,011
AG 2,559,869 2,288,215
Segment assets for reportable segments 12,051,848 11,220,573
Unallocated:
Deferred income tax assets 389,330 349,389
Derivative financial assets 61,184 99,491
Available-for-sale financial assets 35,157 69,962
Interests in associates and joint ventures 20,753 2,763
Unallocated bank deposits and cash and cash equivalents 2,521,366 2,093,983
Unallocated inventories 757,648 597,239
Unallocated deposits, prepayments and other receivables 2,214,124 2,253,370
Income tax recoverable 65,715 58,822
Other unallocated assets 239,968 136,405
Total assets per consolidated balance sheet 18,357,093 16,881,997