Lenovo 2014 Annual Report Download - page 177
Download and view the complete annual report
Please find page 177 of the 2014 Lenovo annual report below. You can navigate through the pages in the report by either clicking on the pages listed below, or by using the keyword search tool below to find specific information within the annual report.-
 1
1 -
2
-
3
-
4
-
5
-
6
-
7
-
8
-
9
-
10
-
11
-
12
-
13
-
14
-
15
-
16
-
17
-
18
-
19
-
20
-
21
-
22
-
23
-
24
-
25
-
26
-
27
-
28
-
29
-
30
-
31
-
32
-
33
-
34
-
35
-
36
-
37
-
38
-
39
-
40
-
41
-
42
-
43
-
44
-
45
-
46
-
47
-
48
-
49
-
50
-
51
-
52
-
53
-
54
-
55
-
56
-
57
-
58
-
59
-
60
-
61
-
62
-
63
-
64
-
65
-
66
-
67
-
68
-
69
-
70
-
71
-
72
-
73
-
74
-
75
-
76
-
77
-
78
-
79
-
80
-
81
-
82
-
83
-
84
-
85
-
86
-
87
-
88
-
89
-
90
-
91
-
92
-
93
-
94
-
95
-
96
-
97
-
98
-
99
-
100
-
101
-
102
-
103
-
104
-
105
-
106
-
107
-
108
-
109
-
110
-
111
-
112
-
113
-
114
-
115
-
116
-
117
-
118
-
119
-
120
-
121
-
122
-
123
-
124
-
125
-
126
-
127
-
128
-
129
-
130
-
131
-
132
-
133
-
134
-
135
-
136
-
137
-
138
-
139
-
140
-
141
-
142
-
143
-
144
-
145
-
146
-
147
-
148
-
149
-
150
-
151
-
152
-
153
-
154
-
155
-
156
-
157
-
158
-
159
-
160
-
161
-
162
-
163
-
164
-
165
-
166
-
 167
167 -
 168
168 -
 169
169 -
 170
170 -
 171
171 -
 172
172 -
 173
173 -
 174
174 -
 175
175 -
 176
176 -
 177
177 -
 178
178 -
 179
179 -
 180
180 -
 181
181 -
 182
182 -
 183
183 -
 184
184 -
 185
185 -
 186
186 -
 187
187 -
188
-
189
-
190
-
191
-
192
-
193
-
194
-
195
-
196
-
197
-
198
-
199
 |
 |
175
2013/14 Annual Report Lenovo Group Limited
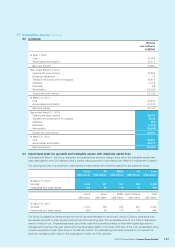
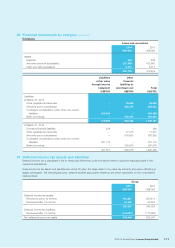
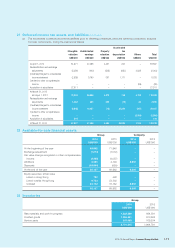
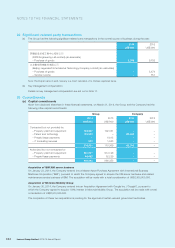
24 Receivables (continued)
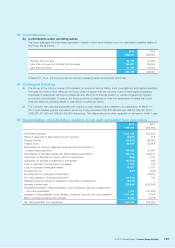
(c) Details of deposits, prepayments and other receivables are as follows:
Group Company
2014 2013 2014 2013
US$’000 US$’000 US$’000 US$’000
Deposits 1,635 2,923 462 448
Other receivables (i) 1,937,679 2,127,671 11 555
Prepayments (ii) 1,061,512 1,104,871 4,526 719
3,000,826 3,235,465 4,999 1,722
Notes:
(i) Majority of other receivables of the Group are amounts due from subcontractors for part components sold in the ordinary course of
business.
(ii) The Group defers the cost of shipped products awaiting revenue recognition until the goods are delivered and revenue is recognized.
In-transit product shipments to customers of US$413 million as at March 31, 2014 (2013: US$180 million) are included in
prepayments.
(d) The carrying amounts of trade, notes and other receivables and deposits approximate their fair values. The maximum
exposure to credit risk at the balance sheet date is the fair value of each class of receivable mentioned above. The Group
does not hold any collateral as security.
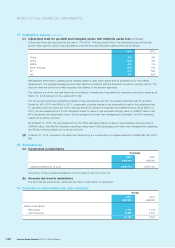
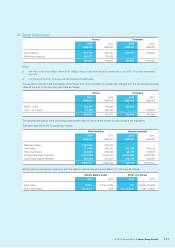
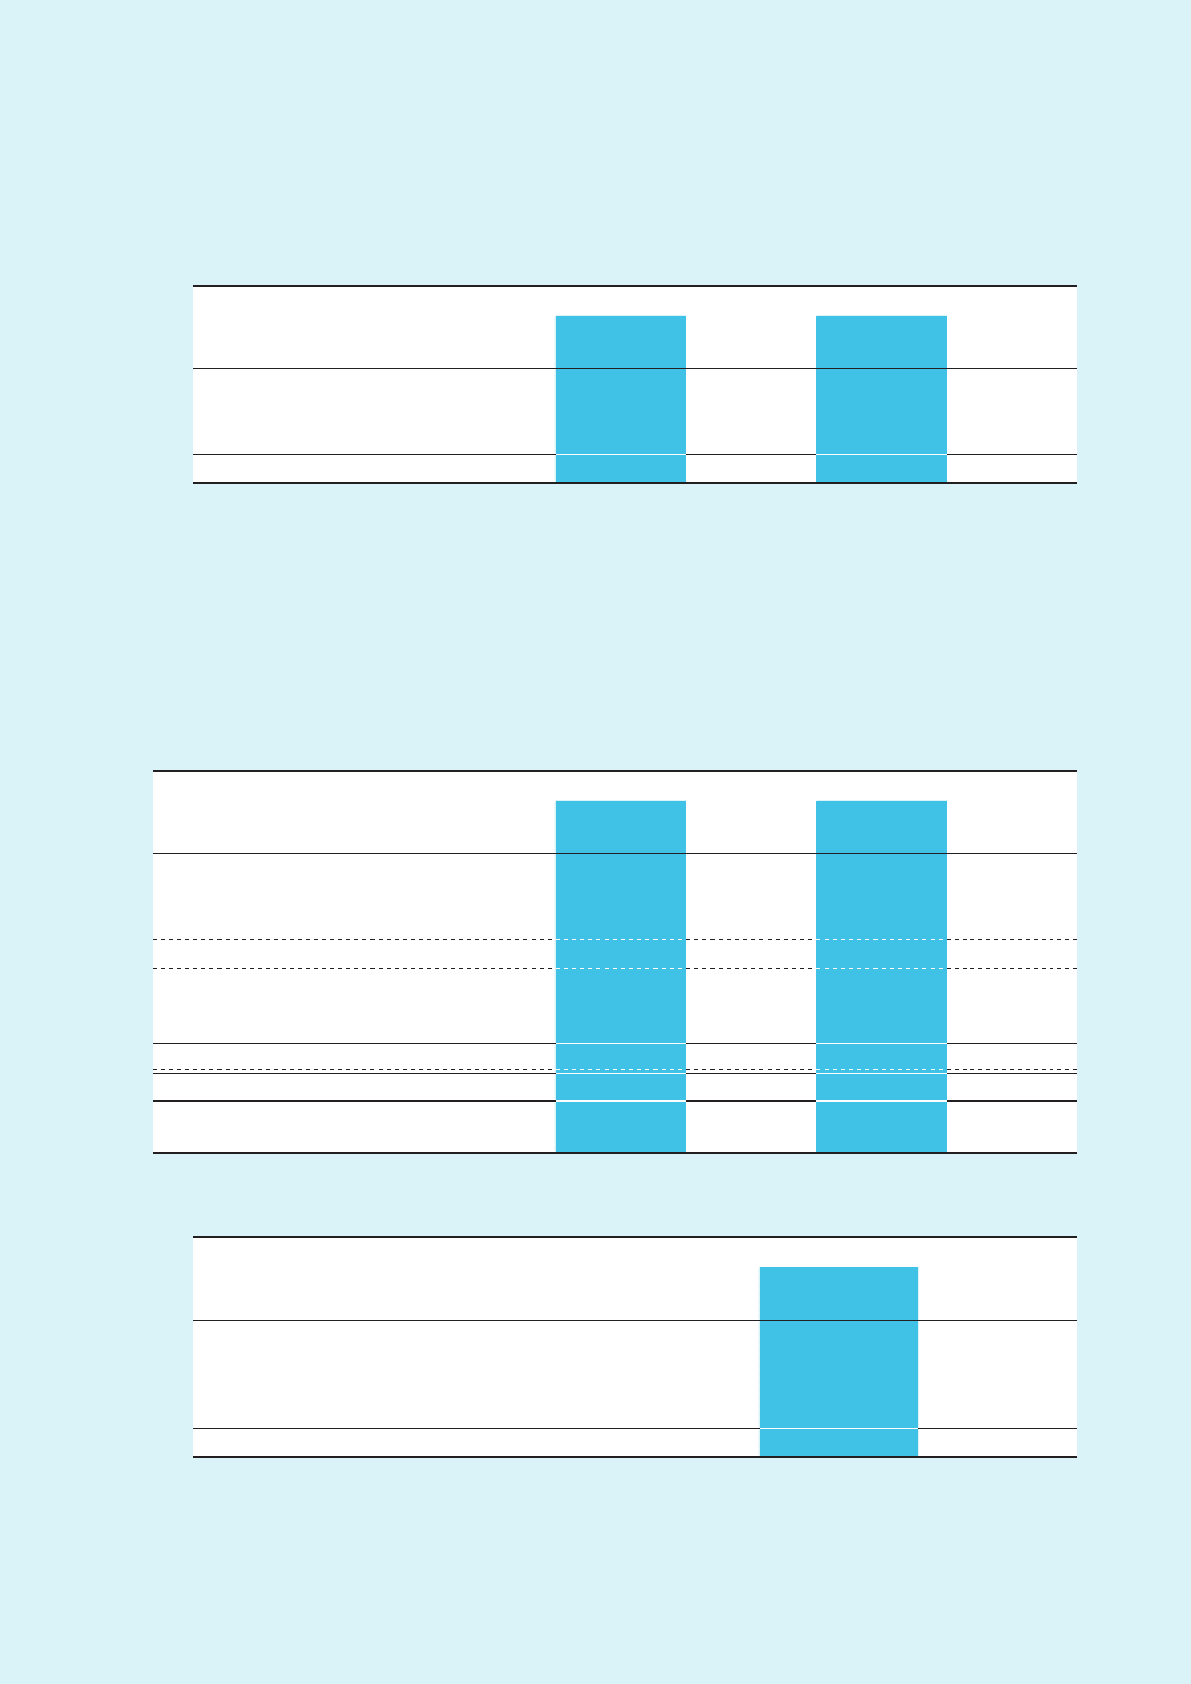
25 Bank deposits and cash and cash equivalents
Group Company
2014 2013 2014 2013
US$’000 US$’000 US$’000 US$’000
Bank deposits
– matured between three to twelve months 94,165 116,696 ––
– restricted bank balances 820 2,359 ––
94,985 119,055 ––
Cash and cash equivalents
– cash at bank and in hand 3,138,440 2,607,810 5,414 6,511
– money market funds 719,704 846,272 ––
3,858,144 3,454,082 5,414 6,511
3,953,129 3,573,137 5,414 6,511
Maximum exposure to credit risk 3,953,129 3,573,137 5,414 6,511
Effective annual interest rates 0%-12.36% 0%-12.42% 0%-0.4% 0%-0.6%
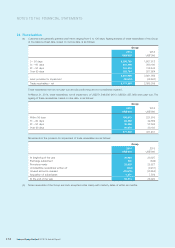
26 Payables
(a) Aging analysis of trade payables of the Group at the balance sheet date, based on invoice date, is as follows:
Group
2014 2013
US$’000 US$’000
0 – 30 days 2,761,170 2,526,465
31 – 60 days 1,217,547 566,747
61 – 90 days 586,145 332,223
Over 90 days 186,483 199,065
4,751,345 3,624,500
(b) Notes payable of the Group are mainly repayable within three months.
(c) The carrying amounts of trade payables and notes payable approximate their fair value.