Lenovo 2014 Annual Report Download - page 30
Download and view the complete annual report
Please find page 30 of the 2014 Lenovo annual report below. You can navigate through the pages in the report by either clicking on the pages listed below, or by using the keyword search tool below to find specific information within the annual report.-
 1
1 -
2
-
3
-
4
-
5
-
6
-
7
-
8
-
9
-
10
-
11
-
12
-
13
-
14
-
15
-
16
-
17
-
18
-
19
-
 20
20 -
 21
21 -
 22
22 -
 23
23 -
 24
24 -
 25
25 -
 26
26 -
 27
27 -
 28
28 -
 29
29 -
 30
30 -
 31
31 -
 32
32 -
 33
33 -
 34
34 -
 35
35 -
 36
36 -
 37
37 -
 38
38 -
 39
39 -
 40
40 -
41
-
42
-
43
-
44
-
45
-
46
-
47
-
48
-
49
-
50
-
51
-
52
-
53
-
54
-
55
-
56
-
57
-
58
-
59
-
60
-
61
-
62
-
63
-
64
-
65
-
66
-
67
-
68
-
69
-
70
-
71
-
72
-
73
-
74
-
75
-
76
-
77
-
78
-
79
-
80
-
81
-
82
-
83
-
84
-
85
-
86
-
87
-
88
-
89
-
90
-
91
-
92
-
93
-
94
-
95
-
96
-
97
-
98
-
99
-
100
-
101
-
102
-
103
-
104
-
105
-
106
-
107
-
108
-
109
-
110
-
111
-
112
-
113
-
114
-
115
-
116
-
117
-
118
-
119
-
120
-
121
-
122
-
123
-
124
-
125
-
126
-
127
-
128
-
129
-
130
-
131
-
132
-
133
-
134
-
135
-
136
-
137
-
138
-
139
-
140
-
141
-
142
-
143
-
144
-
145
-
146
-
147
-
148
-
149
-
150
-
151
-
152
-
153
-
154
-
155
-
156
-
157
-
158
-
159
-
160
-
161
-
162
-
163
-
164
-
165
-
166
-
167
-
168
-
169
-
170
-
171
-
172
-
173
-
174
-
175
-
176
-
177
-
178
-
179
-
180
-
181
-
182
-
183
-
184
-
185
-
186
-
187
-
188
-
189
-
190
-
191
-
192
-
193
-
194
-
195
-
196
-
197
-
198
-
199
 |
 |
28 Lenovo Group Limited 2013/14 Annual Report
MANAGEMENT’S DISCUSSION & ANALYSIS
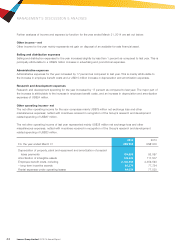
Other non-current liabilities
Other non-current liabilities mainly comprise contingent considerations and deferred consideration in respect of certain
completed business combinations, provision for environmental restoration, written put option liability in connection with
a joint venture and government incentives and grants received in advance.
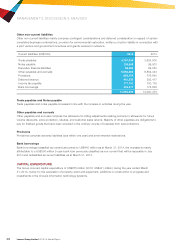
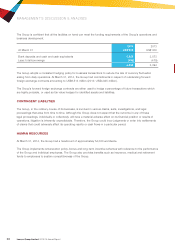
Current liabilities (US$’000) 2014 2013
Trade payables 4,751,345 3,624,500
Notes payable 108,559 99,503
Derivative financial liabilities 58,462 69,053
Other payables and accruals 6,658,254 6,852,344
Provisions 852,154 776,640
Deferred revenue 410,330 393,417
Income tax payable 177,741 100,179
Bank borrowings 445,477 175,838
13,462,322 12,091,474
Trade payables and Notes payable
Trade payables and notes payable increased in line with the increase in activities during the year.
Other payables and accruals
Other payables and accruals comprise the allowance for billing adjustments relating primarily to allowance for future
volume discounts, price protection, rebates, and customer sales returns. Majority of other payables are obligations to
pay for finished goods that have been acquired in the ordinary course of business from subcontractors.
Provisions
Provisions comprise warranty liabilities (due within one year) and environmental restorations.
Bank borrowings
Bank borrowings (classified as current) amounted to US$445 million as at March 31, 2014, the increase is mainly
attributable to a US$300 million 5-year bank loan previously classified as non-current that will be repayable in July
2014 and reclassified as current liabilities as at March 31, 2014.
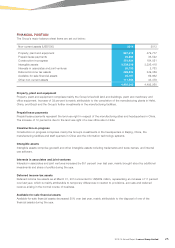
CAPITAL EXPENDITURE
The Group incurred capital expenditure of US$675 million (2013: US$441 million) during the year ended March
31, 2014, mainly for the acquisition of property, plant and equipment, additions in construction-in-progress and
investments in the Group’s information technology systems.