Lenovo 2014 Annual Report Download - page 153
Download and view the complete annual report
Please find page 153 of the 2014 Lenovo annual report below. You can navigate through the pages in the report by either clicking on the pages listed below, or by using the keyword search tool below to find specific information within the annual report.-
 1
1 -
2
-
3
-
4
-
5
-
6
-
7
-
8
-
9
-
10
-
11
-
12
-
13
-
14
-
15
-
16
-
17
-
18
-
19
-
20
-
21
-
22
-
23
-
24
-
25
-
26
-
27
-
28
-
29
-
30
-
31
-
32
-
33
-
34
-
35
-
36
-
37
-
38
-
39
-
40
-
41
-
42
-
43
-
44
-
45
-
46
-
47
-
48
-
49
-
50
-
51
-
52
-
53
-
54
-
55
-
56
-
57
-
58
-
59
-
60
-
61
-
62
-
63
-
64
-
65
-
66
-
67
-
68
-
69
-
70
-
71
-
72
-
73
-
74
-
75
-
76
-
77
-
78
-
79
-
80
-
81
-
82
-
83
-
84
-
85
-
86
-
87
-
88
-
89
-
90
-
91
-
92
-
93
-
94
-
95
-
96
-
97
-
98
-
99
-
100
-
101
-
102
-
103
-
104
-
105
-
106
-
107
-
108
-
109
-
110
-
111
-
112
-
113
-
114
-
115
-
116
-
117
-
118
-
119
-
120
-
121
-
122
-
123
-
124
-
125
-
126
-
127
-
128
-
129
-
130
-
131
-
132
-
133
-
134
-
135
-
136
-
137
-
138
-
139
-
140
-
141
-
142
-
 143
143 -
 144
144 -
 145
145 -
 146
146 -
 147
147 -
 148
148 -
 149
149 -
 150
150 -
 151
151 -
 152
152 -
 153
153 -
 154
154 -
 155
155 -
 156
156 -
 157
157 -
 158
158 -
 159
159 -
 160
160 -
 161
161 -
 162
162 -
 163
163 -
164
-
165
-
166
-
167
-
168
-
169
-
170
-
171
-
172
-
173
-
174
-
175
-
176
-
177
-
178
-
179
-
180
-
181
-
182
-
183
-
184
-
185
-
186
-
187
-
188
-
189
-
190
-
191
-
192
-
193
-
194
-
195
-
196
-
197
-
198
-
199
 |
 |
151
2013/14 Annual Report Lenovo Group Limited
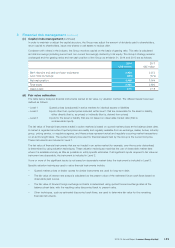
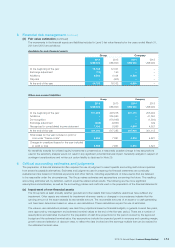
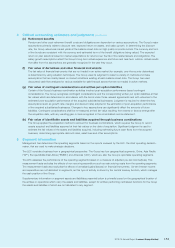
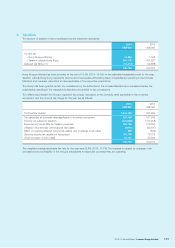
3 Financial risk management (continued)
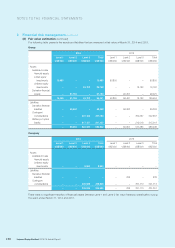
(d) Fair value estimation (continued)
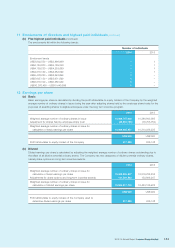
The movements in the financial assets and liabilities included in Level 3 fair value hierarchy for the years ended March 31,
2014 and 2013 are as follows:
Available-for-sale financial assets
Group Company
2014 2013 2014 2013
US$’000 US$’000 US$’000 US$’000
At the beginning of the year 16,162 12,321 ––
Exchange adjustment (10) 140 ––
Additions 8,550 4,104 8,500 –
Disposal –(403) ––
At the end of the year 24,702 16,162 8,500 –
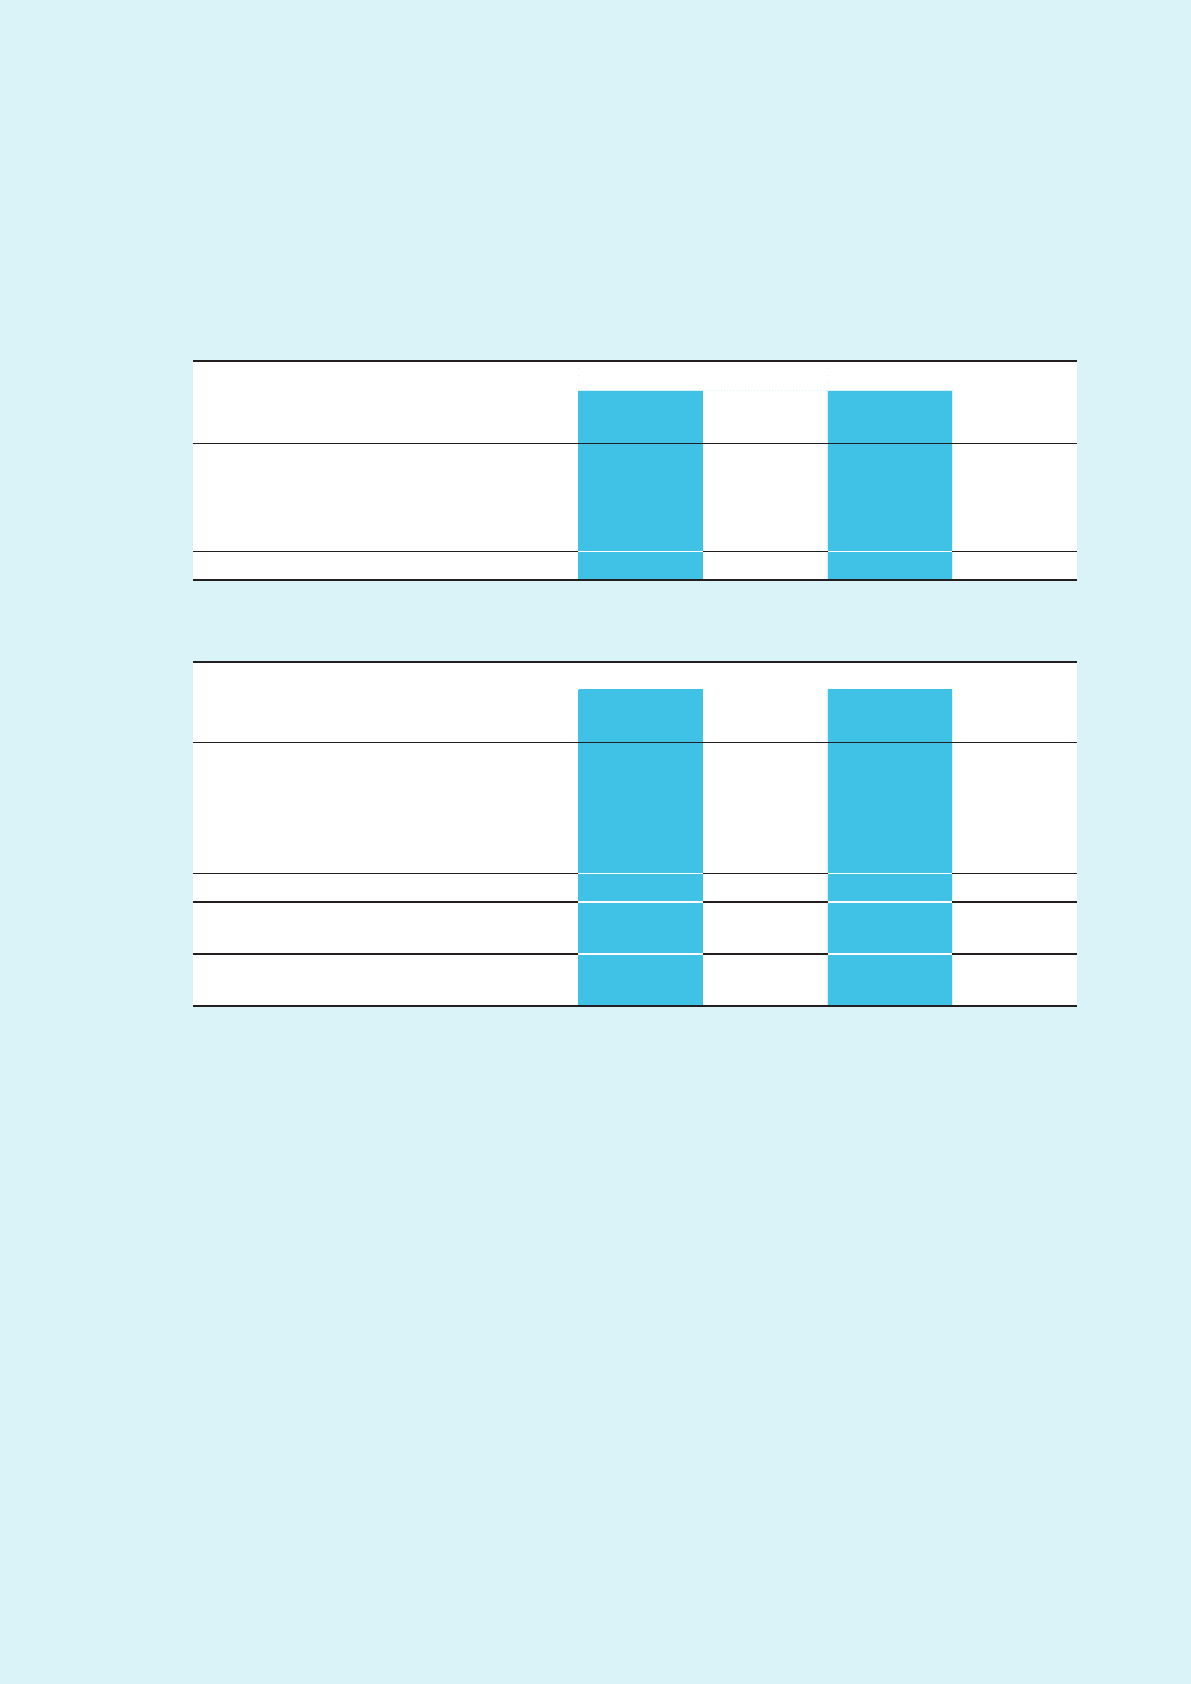
Other non-current liabilities
Group Company
2014 2013 2014 2013
US$’000 US$’000 US$’000 US$’000
At the beginning of the year 517,385 428,915 301,113 256,093
Additions –255,680 –41,550
De-recognition –(170,645) –(1,500)
Exchange adjustment (235) (4,661) –349
Recognized in consolidated income statement 7,190 8,096 4,816 4,621
At the end of the year 524,340 517,385 305,929 301,113
Total losses for the year included in profit or
loss under “finance costs” 6,955 7,861 4,816 4,621
Changes in unrealized losses for the year included
in profit or loss 6,955 7,861 4,816 4,621
No sensitivity analysis for unlisted equity investments is presented as a reasonably possible change in key assumptions
used in the sensitivity analysis would not result in any significant potential financial impact. Sensitivity analysis in respect of
contingent considerations and written put option liability is disclosed in Note 29.
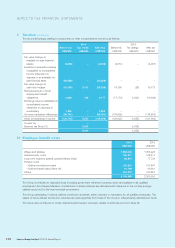
4 Critical accounting estimates and judgments
The preparation of financial statements often requires the use of judgment to select specific accounting methods and policies
from several acceptable alternatives. Estimates and judgments used in preparing the financial statements are continually
evaluated and are based on historical experience and other factors, including expectations of future events that are believed
to be reasonable under the circumstances. The Group makes estimates and assumptions concerning the future. The resulting
accounting estimates will, by definition, seldom equal the related actual results. The following are the more significant
assumptions and estimates, as well as the accounting policies and methods used in the preparation of the financial statements:
(a) Impairment of non-financial assets
The Group tests at least annually whether goodwill and other assets that have indefinite useful lives have suffered any
impairment. Other assets are reviewed for impairment whenever events or changes in circumstances indicate that the
carrying amount of the asset exceeds its recoverable amount. The recoverable amounts of an asset or a cash-generating
unit have been determined based on value-in-use calculations. These calculations require the use of estimates.
The value-in-use calculations primarily use cash flow projections based on financial budgets, in general covered five years,
were approved by management and estimated terminal values at the end of the five-year period. There are a number of
assumptions and estimates involved for the preparation of cash flow projections for the period covered by the approved
budget and the estimated terminal value. Key assumptions include the expected growth in revenues and operating margin,
growth rates and selection of discount rates, to reflect the risks involved and the earnings multiple that can be realized for
the estimated terminal value.