Lenovo 2014 Annual Report Download - page 28
Download and view the complete annual report
Please find page 28 of the 2014 Lenovo annual report below. You can navigate through the pages in the report by either clicking on the pages listed below, or by using the keyword search tool below to find specific information within the annual report.-
 1
1 -
2
-
3
-
4
-
5
-
6
-
7
-
8
-
9
-
10
-
11
-
12
-
13
-
14
-
15
-
16
-
17
-
 18
18 -
 19
19 -
 20
20 -
 21
21 -
 22
22 -
 23
23 -
 24
24 -
 25
25 -
 26
26 -
 27
27 -
 28
28 -
 29
29 -
 30
30 -
 31
31 -
 32
32 -
 33
33 -
 34
34 -
 35
35 -
 36
36 -
 37
37 -
 38
38 -
39
-
40
-
41
-
42
-
43
-
44
-
45
-
46
-
47
-
48
-
49
-
50
-
51
-
52
-
53
-
54
-
55
-
56
-
57
-
58
-
59
-
60
-
61
-
62
-
63
-
64
-
65
-
66
-
67
-
68
-
69
-
70
-
71
-
72
-
73
-
74
-
75
-
76
-
77
-
78
-
79
-
80
-
81
-
82
-
83
-
84
-
85
-
86
-
87
-
88
-
89
-
90
-
91
-
92
-
93
-
94
-
95
-
96
-
97
-
98
-
99
-
100
-
101
-
102
-
103
-
104
-
105
-
106
-
107
-
108
-
109
-
110
-
111
-
112
-
113
-
114
-
115
-
116
-
117
-
118
-
119
-
120
-
121
-
122
-
123
-
124
-
125
-
126
-
127
-
128
-
129
-
130
-
131
-
132
-
133
-
134
-
135
-
136
-
137
-
138
-
139
-
140
-
141
-
142
-
143
-
144
-
145
-
146
-
147
-
148
-
149
-
150
-
151
-
152
-
153
-
154
-
155
-
156
-
157
-
158
-
159
-
160
-
161
-
162
-
163
-
164
-
165
-
166
-
167
-
168
-
169
-
170
-
171
-
172
-
173
-
174
-
175
-
176
-
177
-
178
-
179
-
180
-
181
-
182
-
183
-
184
-
185
-
186
-
187
-
188
-
189
-
190
-
191
-
192
-
193
-
194
-
195
-
196
-
197
-
198
-
199
 |
 |

26 Lenovo Group Limited 2013/14 Annual Report
MANAGEMENT’S DISCUSSION & ANALYSIS
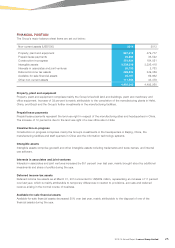
Other non-current assets
Other non-current assets amounted to US$112 million as at March 31, 2014, representing prepayment for construction
of staff quarters and new office building in China and long term deposits.
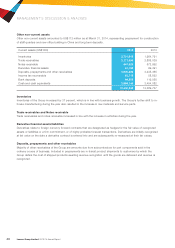
Current assets (US$’000) 2014 2013
Inventories 2,701,015 1,964,791
Trade receivables 3,171,354 2,885,039
Notes receivable 447,325 572,992
Derivative financial assets 61,184 99,491
Deposits, prepayments and other receivables 3,000,826 3,235,465
Income tax recoverable 65,715 58,822
Bank deposits 94,985 119,055
Cash and cash equivalents 3,858,144 3,454,082
13,400,548 12,389,737
Inventories
Inventories of the Group increased by 37 percent, which is in line with business growth. The Group’s further shift to in-
house manufacturing during the year also resulted in the increase in raw materials and service parts.
Trade receivables and Notes receivable
Trade receivables and notes receivable increased in line with the increase in activities during the year.
Derivative financial assets/liabilities
Derivatives relate to foreign currency forward contracts that are designated as hedges for the fair value of recognized
assets or liabilities or a firm commitment, or of highly probable forecast transactions. Derivatives are initially recognized
at fair value on the date a derivative contract is entered into and are subsequently re-measured at their fair values.
Deposits, prepayments and other receivables
Majority of other receivables of the Group are amounts due from subcontractors for part components sold in the
ordinary course of business. Included in prepayments are in-transit product shipments to customers by which the
Group defers the cost of shipped products awaiting revenue recognition until the goods are delivered and revenue is
recognized.