Lenovo 2014 Annual Report Download - page 150
Download and view the complete annual report
Please find page 150 of the 2014 Lenovo annual report below. You can navigate through the pages in the report by either clicking on the pages listed below, or by using the keyword search tool below to find specific information within the annual report.-
 1
1 -
2
-
3
-
4
-
5
-
6
-
7
-
8
-
9
-
10
-
11
-
12
-
13
-
14
-
15
-
16
-
17
-
18
-
19
-
20
-
21
-
22
-
23
-
24
-
25
-
26
-
27
-
28
-
29
-
30
-
31
-
32
-
33
-
34
-
35
-
36
-
37
-
38
-
39
-
40
-
41
-
42
-
43
-
44
-
45
-
46
-
47
-
48
-
49
-
50
-
51
-
52
-
53
-
54
-
55
-
56
-
57
-
58
-
59
-
60
-
61
-
62
-
63
-
64
-
65
-
66
-
67
-
68
-
69
-
70
-
71
-
72
-
73
-
74
-
75
-
76
-
77
-
78
-
79
-
80
-
81
-
82
-
83
-
84
-
85
-
86
-
87
-
88
-
89
-
90
-
91
-
92
-
93
-
94
-
95
-
96
-
97
-
98
-
99
-
100
-
101
-
102
-
103
-
104
-
105
-
106
-
107
-
108
-
109
-
110
-
111
-
112
-
113
-
114
-
115
-
116
-
117
-
118
-
119
-
120
-
121
-
122
-
123
-
124
-
125
-
126
-
127
-
128
-
129
-
130
-
131
-
132
-
133
-
134
-
135
-
136
-
137
-
138
-
139
-
 140
140 -
 141
141 -
 142
142 -
 143
143 -
 144
144 -
 145
145 -
 146
146 -
 147
147 -
 148
148 -
 149
149 -
 150
150 -
 151
151 -
 152
152 -
 153
153 -
 154
154 -
 155
155 -
 156
156 -
 157
157 -
 158
158 -
 159
159 -
 160
160 -
161
-
162
-
163
-
164
-
165
-
166
-
167
-
168
-
169
-
170
-
171
-
172
-
173
-
174
-
175
-
176
-
177
-
178
-
179
-
180
-
181
-
182
-
183
-
184
-
185
-
186
-
187
-
188
-
189
-
190
-
191
-
192
-
193
-
194
-
195
-
196
-
197
-
198
-
199
 |
 |

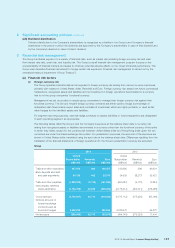
148 Lenovo Group Limited 2013/14 Annual Report
NOTES TO THE FINANCIAL STATEMENTS
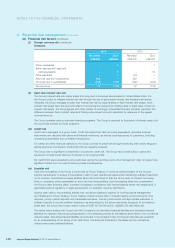
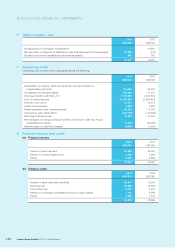
3 Financial risk management (continued)
(a) Financial risk factors (continued)
(iv) Liquidity risk (continued)
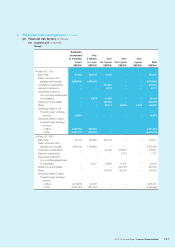
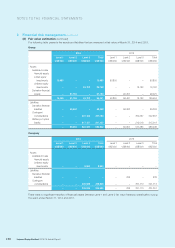
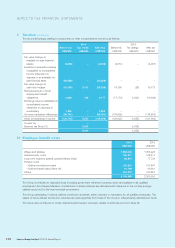
Company
Repayable
on demand
or 3 months
or less
Over
3 months
to 1 year
Over
1 to 3 years
Over
3 to 5 years Total
US$’000 US$’000 US$’000 US$’000 US$’000
At March 31, 2014
Bank loans –300,000 – – 300,000
Other payables and accruals –36,685 – – 36,685
Amounts due to subsidiaries 525,553 –––525,553
Contingent considerations – – 317,000 –317,000
At March 31, 2013
Bank loans – – 300,000 –300,000
Other payables and accruals –17,415 – – 17,415
Amounts due to subsidiaries 676,663 –––676,663
Contingent considerations – – 42,000 275,000 317,000
Forward foreign exchange contracts 238 – – – 238
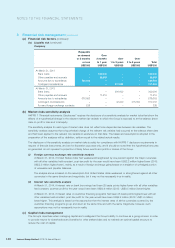
(b) Market risks sensitivity analysis
HKFRS 7 “Financial instruments: Disclosures” requires the disclosure of a sensitivity analysis for market risks that show the
effects of a hypothetical change in the relevant market risk variable to which the Group is exposed to at the balance sheet
date on profit or loss and total equity.
The sensitivity analysis for each type of market risks does not reflect inter-dependencies between risk variables. The
sensitivity analysis assumes that a hypothetical change of the relevant risk variable had occurred at the balance sheet date
and had been applied to the relevant risk variable in existence on that date. The bases and assumptions adopted in the
preparation of the analyses will by definition, seldom equal to the related actual results.
The disclosure of the sensitivity analysis on market risks is solely for compliance with HKFRS 7 disclosure requirements in
respect of financial instruments, and are for illustration purposes only; and it should be noted that the hypothetical amounts
so generated do not represent a projection of likely future events and profits or losses of the Group.
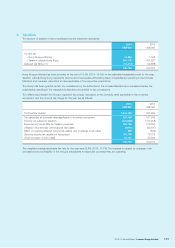
(i) Foreign currency exchange rate sensitivity analysis
At March 31, 2014, if United States dollar had weakened/strengthened by one percent against the major currencies
with all other variables held constant, post-tax profit for the year would have been US$2.2 million higher/lower (2013:
US$2.3 million higher/lower), mainly as a result of foreign exchange gains/losses on translation of unhedged portion
of receivable and payable balances.
The analysis above is based on the assumption that United States dollar weakened or strengthened against all other
currencies in the same direction and magnitude, but it may not be necessarily true in reality.
(ii) Interest rate sensitivity analysis
At March 31, 2014, if interest rate on bank borrowings had been 25 basis points higher/lower with all other variables
held constant, post-tax profit for the year would have been US$0.9 million (2013: US$0.5 million) lower/higher.
At March 31, 2014, if interest rates on customer financing programs had been 25 basis points higher/lower with all
other variables held constant, post-tax profit for the year would have been US$2.2 million (2013: US$1.6 million)
lower/higher. This analysis is based on the assumption that the interest rates of all the currencies covered by the
customer financing programs go up and down at the same time and with the same magnitude; however, such
assumptions may not be necessarily true in reality.
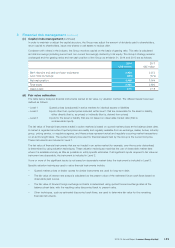
(c) Capital risks management
The Group’s objectives when managing capital are to safeguard the Group’s ability to continue as a going concern in order
to provide returns for shareholders and benefits for other stakeholders and to maintain an optimal capital structure to
reduce the cost of capital.