Lenovo 2014 Annual Report Download - page 175
Download and view the complete annual report
Please find page 175 of the 2014 Lenovo annual report below. You can navigate through the pages in the report by either clicking on the pages listed below, or by using the keyword search tool below to find specific information within the annual report.-
 1
1 -
2
-
3
-
4
-
5
-
6
-
7
-
8
-
9
-
10
-
11
-
12
-
13
-
14
-
15
-
16
-
17
-
18
-
19
-
20
-
21
-
22
-
23
-
24
-
25
-
26
-
27
-
28
-
29
-
30
-
31
-
32
-
33
-
34
-
35
-
36
-
37
-
38
-
39
-
40
-
41
-
42
-
43
-
44
-
45
-
46
-
47
-
48
-
49
-
50
-
51
-
52
-
53
-
54
-
55
-
56
-
57
-
58
-
59
-
60
-
61
-
62
-
63
-
64
-
65
-
66
-
67
-
68
-
69
-
70
-
71
-
72
-
73
-
74
-
75
-
76
-
77
-
78
-
79
-
80
-
81
-
82
-
83
-
84
-
85
-
86
-
87
-
88
-
89
-
90
-
91
-
92
-
93
-
94
-
95
-
96
-
97
-
98
-
99
-
100
-
101
-
102
-
103
-
104
-
105
-
106
-
107
-
108
-
109
-
110
-
111
-
112
-
113
-
114
-
115
-
116
-
117
-
118
-
119
-
120
-
121
-
122
-
123
-
124
-
125
-
126
-
127
-
128
-
129
-
130
-
131
-
132
-
133
-
134
-
135
-
136
-
137
-
138
-
139
-
140
-
141
-
142
-
143
-
144
-
145
-
146
-
147
-
148
-
149
-
150
-
151
-
152
-
153
-
154
-
155
-
156
-
157
-
158
-
159
-
160
-
161
-
162
-
163
-
164
-
 165
165 -
 166
166 -
 167
167 -
 168
168 -
 169
169 -
 170
170 -
 171
171 -
 172
172 -
 173
173 -
 174
174 -
 175
175 -
 176
176 -
 177
177 -
 178
178 -
 179
179 -
 180
180 -
 181
181 -
 182
182 -
 183
183 -
 184
184 -
 185
185 -
186
-
187
-
188
-
189
-
190
-
191
-
192
-
193
-
194
-
195
-
196
-
197
-
198
-
199
 |
 |
173
2013/14 Annual Report Lenovo Group Limited
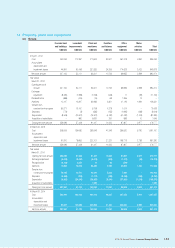
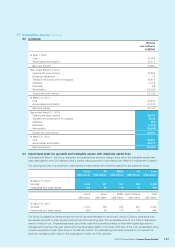
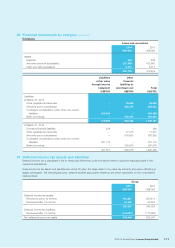
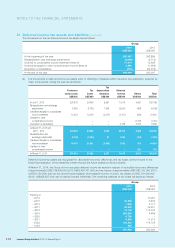
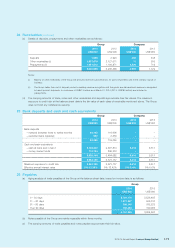
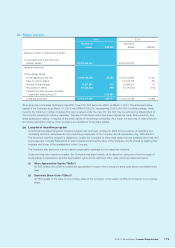
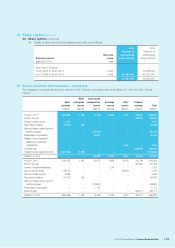
21 Deferred income tax assets and liabilities
(continued)
(b) The movements in deferred income tax liabilities (prior to offsetting of balances within the same tax jurisdiction), analyzed
by major components, during the year are as follows:
Intangible
valuation
Undistributed
earnings
Property
valuation
Accelerated
tax
depreciation Others Total
US$’000 US$’000 US$’000 US$’000 US$000 US$’000
At April 1, 2012 51,971 27,268 4,401 227 –83,867
Reclassification and exchange
adjustments (5,254) (442) (525) (650) 4,828 (2,043)
(Credited)/charged to consolidated
income statement (2,535) 9,760 397 1,171 –8,793
Credited to other comprehensive
income – – – – (99) (99)
Acquisition of subsidiaries 27,911 – – – – 27,911
At March 31, 2013
and April 1, 2013 72,093 36,586 4,273 748 4,729 118,429
Reclassification and exchange
adjustments 1,463 485 333 (18) 33 2,296
(Credited)/charged to consolidated
income statement (5,845) 10,427 (12) 23,864 (247) 28,187
Credited to other comprehensive
income – – – – (2,999) (2,999)
Acquisition of subsidiaries 216 – – – – 216
At March 31, 2014 67,927 47,498 4,594 24,594 1,516 146,129
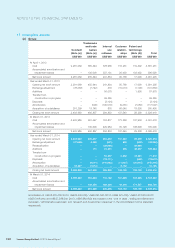
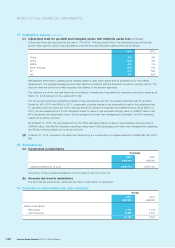
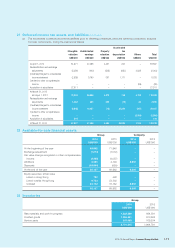
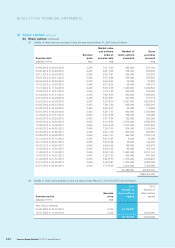
22 Available-for-sale financial assets
Group Company
2014 2013 2014 2013
US$’000 US$’000 US$’000 US$’000
At the beginning of the year 69,962 71,946 ––
Exchange adjustment (1,073) (1,072) ––
Fair value change recognized in other comprehensive
income (2,288) (4,057) ––
Additions 8,550 4,104 8,500 –
Disposals (39,994) (959) ––
At the end of the year 35,157 69,962 8,500 –
Equity securities, at fair value
Listed in Hong Kong 722 498 ––
Listed outside Hong Kong 9,733 53,302 ––
Unlisted 24,702 16,162 8,500 –
35,157 69,962 8,500 –
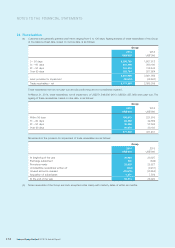
23 Inventories
Group
2014 2013
US$’000 US$’000
Raw materials and work-in-progress 1,222,589 884,591
Finished goods 1,263,341 910,666
Service parts 215,085 169,534
2,701,015 1,964,791