Lenovo 2014 Annual Report Download - page 163
Download and view the complete annual report
Please find page 163 of the 2014 Lenovo annual report below. You can navigate through the pages in the report by either clicking on the pages listed below, or by using the keyword search tool below to find specific information within the annual report.-
 1
1 -
2
-
3
-
4
-
5
-
6
-
7
-
8
-
9
-
10
-
11
-
12
-
13
-
14
-
15
-
16
-
17
-
18
-
19
-
20
-
21
-
22
-
23
-
24
-
25
-
26
-
27
-
28
-
29
-
30
-
31
-
32
-
33
-
34
-
35
-
36
-
37
-
38
-
39
-
40
-
41
-
42
-
43
-
44
-
45
-
46
-
47
-
48
-
49
-
50
-
51
-
52
-
53
-
54
-
55
-
56
-
57
-
58
-
59
-
60
-
61
-
62
-
63
-
64
-
65
-
66
-
67
-
68
-
69
-
70
-
71
-
72
-
73
-
74
-
75
-
76
-
77
-
78
-
79
-
80
-
81
-
82
-
83
-
84
-
85
-
86
-
87
-
88
-
89
-
90
-
91
-
92
-
93
-
94
-
95
-
96
-
97
-
98
-
99
-
100
-
101
-
102
-
103
-
104
-
105
-
106
-
107
-
108
-
109
-
110
-
111
-
112
-
113
-
114
-
115
-
116
-
117
-
118
-
119
-
120
-
121
-
122
-
123
-
124
-
125
-
126
-
127
-
128
-
129
-
130
-
131
-
132
-
133
-
134
-
135
-
136
-
137
-
138
-
139
-
140
-
141
-
142
-
143
-
144
-
145
-
146
-
147
-
148
-
149
-
150
-
151
-
152
-
 153
153 -
 154
154 -
 155
155 -
 156
156 -
 157
157 -
 158
158 -
 159
159 -
 160
160 -
 161
161 -
 162
162 -
 163
163 -
 164
164 -
 165
165 -
 166
166 -
 167
167 -
 168
168 -
 169
169 -
 170
170 -
 171
171 -
 172
172 -
 173
173 -
174
-
175
-
176
-
177
-
178
-
179
-
180
-
181
-
182
-
183
-
184
-
185
-
186
-
187
-
188
-
189
-
190
-
191
-
192
-
193
-
194
-
195
-
196
-
197
-
198
-
199
 |
 |
161
2013/14 Annual Report Lenovo Group Limited
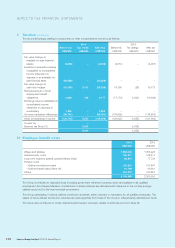
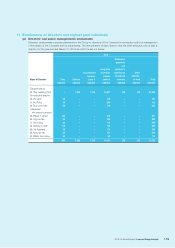
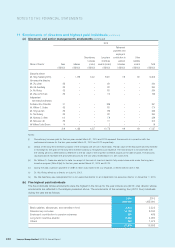
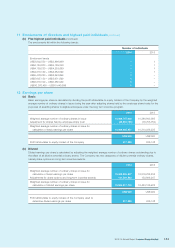
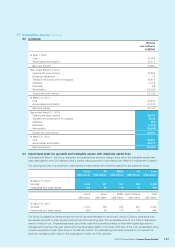
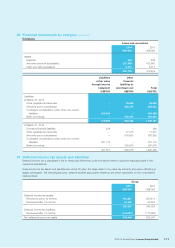
11 Emoluments of directors and highest paid individuals
(continued)
(b) Five highest paid individuals
(continued)
The emoluments fell within the following bands:
Number of individuals
2014 2013
Emolument bands
US$3,802,550 – US$3,866,999 –1
US$4,124,800 – US$4,189,249 –1
US$4,189,250 – US$4,253,699 –1
US$4,318,150 – US$4,382,599 –1
US$5,478,250 – US$5,542,699 1–
US$5,607,150 – US$5,671,599 1–
US$6,316,100 – US$6,380,549 1–
US$10,376,450 – US$10,440,899 1–
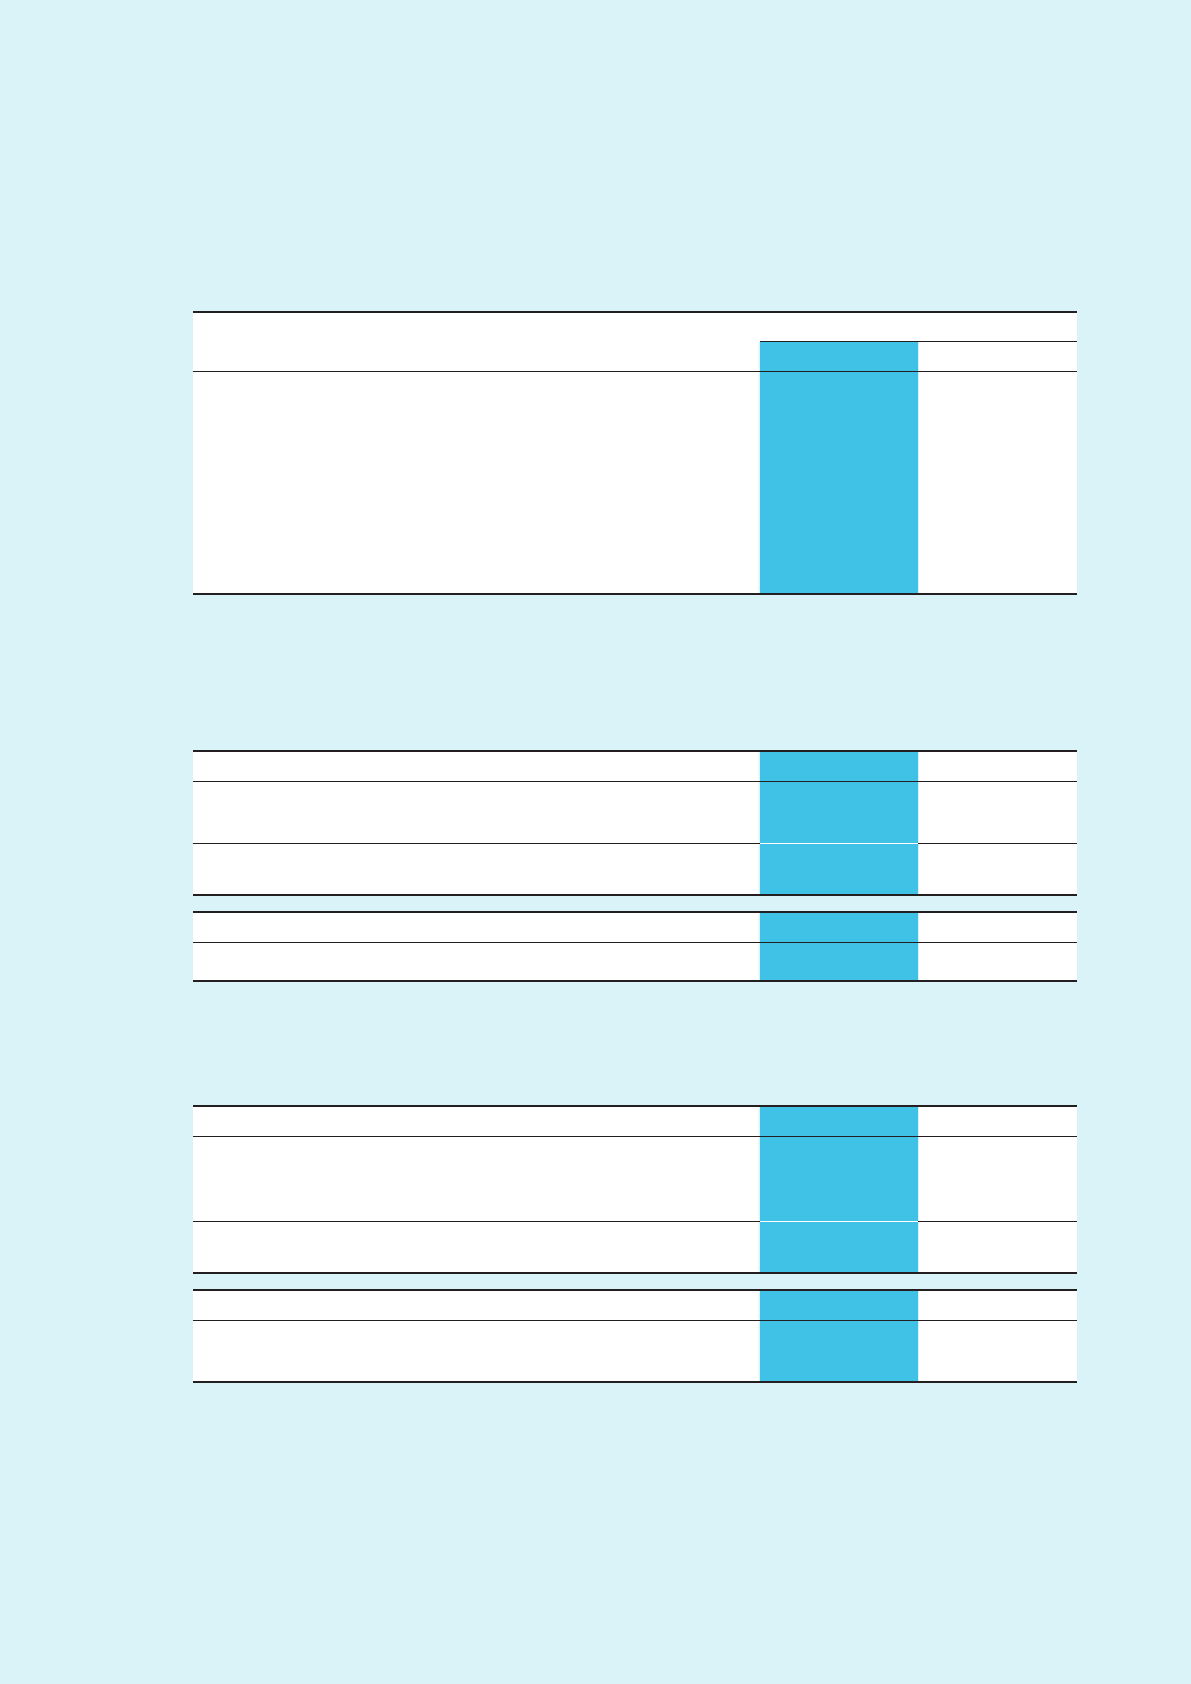
12 Earnings per share
(a) Basic
Basic earnings per share is calculated by dividing the profit attributable to equity holders of the Company by the weighted
average number of ordinary shares in issue during the year after adjusting shares held by the employee share trusts for the
purposes of awarding shares to eligible employees under the long term incentive program.
2014 2013
Weighted average number of ordinary shares in issue 10,408,747,622 10,386,943,985
Adjustment for shares held by employee share trust (38,861,785) (76,705,750)
Weighted average number of ordinary shares in issue for
calculation of basic earnings per share 10,369,885,837 10,310,238,235
US$’000 US$’000
Profit attributable to equity holders of the Company 817,228 635,148
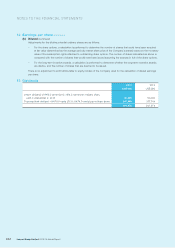
(b) Diluted
Diluted earnings per share is calculated by adjusting the weighted average number of ordinary shares outstanding due to
the effect of all dilutive potential ordinary shares. The Company has two categories of dilutive potential ordinary shares,
namely share options and long-term incentive awards.
2014 2013
Weighted average number of ordinary shares in issue for
calculation of basic earnings per share 10,369,885,837 10,310,238,235
Adjustments for share options and long-term incentive awards 131,031,863 152,898,247
Weighted average number of ordinary shares in issue for
calculation of diluted earnings per share 10,500,917,700 10,463,136,482
US$’000 US$’000
Profit attributable to equity holders of the Company used to
determine diluted earnings per share 817,228 635,148