Lenovo 2014 Annual Report Download - page 128
Download and view the complete annual report
Please find page 128 of the 2014 Lenovo annual report below. You can navigate through the pages in the report by either clicking on the pages listed below, or by using the keyword search tool below to find specific information within the annual report.-
 1
1 -
2
-
3
-
4
-
5
-
6
-
7
-
8
-
9
-
10
-
11
-
12
-
13
-
14
-
15
-
16
-
17
-
18
-
19
-
20
-
21
-
22
-
23
-
24
-
25
-
26
-
27
-
28
-
29
-
30
-
31
-
32
-
33
-
34
-
35
-
36
-
37
-
38
-
39
-
40
-
41
-
42
-
43
-
44
-
45
-
46
-
47
-
48
-
49
-
50
-
51
-
52
-
53
-
54
-
55
-
56
-
57
-
58
-
59
-
60
-
61
-
62
-
63
-
64
-
65
-
66
-
67
-
68
-
69
-
70
-
71
-
72
-
73
-
74
-
75
-
76
-
77
-
78
-
79
-
80
-
81
-
82
-
83
-
84
-
85
-
86
-
87
-
88
-
89
-
90
-
91
-
92
-
93
-
94
-
95
-
96
-
97
-
98
-
99
-
100
-
101
-
102
-
103
-
104
-
105
-
106
-
107
-
108
-
109
-
110
-
111
-
112
-
113
-
114
-
115
-
116
-
117
-
 118
118 -
 119
119 -
 120
120 -
 121
121 -
 122
122 -
 123
123 -
 124
124 -
 125
125 -
 126
126 -
 127
127 -
 128
128 -
 129
129 -
 130
130 -
 131
131 -
 132
132 -
 133
133 -
 134
134 -
 135
135 -
 136
136 -
 137
137 -
 138
138 -
139
-
140
-
141
-
142
-
143
-
144
-
145
-
146
-
147
-
148
-
149
-
150
-
151
-
152
-
153
-
154
-
155
-
156
-
157
-
158
-
159
-
160
-
161
-
162
-
163
-
164
-
165
-
166
-
167
-
168
-
169
-
170
-
171
-
172
-
173
-
174
-
175
-
176
-
177
-
178
-
179
-
180
-
181
-
182
-
183
-
184
-
185
-
186
-
187
-
188
-
189
-
190
-
191
-
192
-
193
-
194
-
195
-
196
-
197
-
198
-
199
 |
 |
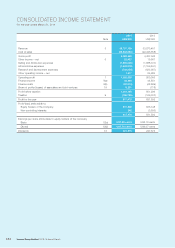
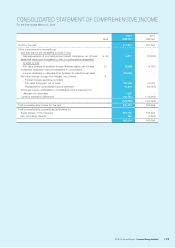
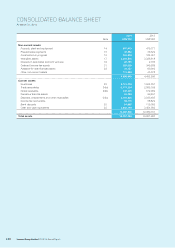
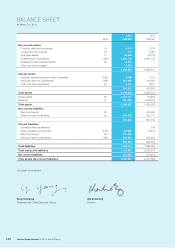
126 Lenovo Group Limited 2013/14 Annual Report
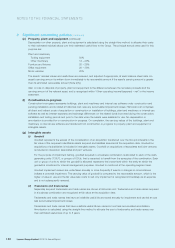
CONSOLIDATED BALANCE SHEET
At March 31, 2014
2014 2013
Note US$’000 US$’000
Non-current assets
Property, plant and equipment 14 667,413 479,777
Prepaid lease payments 15 40,884 36,522
Construction-in-progress 16 351,934 184,051
Intangible assets 17 3,339,516 3,326,418
Interests in associates and joint ventures 19 20,753 2,763
Deferred income tax assets 21 389,330 349,389
Available-for-sale financial assets 22 35,157 69,962
Other non-current assets 111,558 43,378
4,956,545 4,492,260
Current assets
Inventories 23 2,701,015 1,964,791
Trade receivables 24(a) 3,171,354 2,885,039
Notes receivable 24(b) 447,325 572,992
Derivative financial assets 61,184 99,491
Deposits, prepayments and other receivables 24(c) 3,000,826 3,235,465
Income tax recoverable 65,715 58,822
Bank deposits 25 94,985 119,055
Cash and cash equivalents 25 3,858,144 3,454,082
13,400,548 12,389,737
Total assets 18,357,093 16,881,997