Lenovo 2014 Annual Report Download - page 27
Download and view the complete annual report
Please find page 27 of the 2014 Lenovo annual report below. You can navigate through the pages in the report by either clicking on the pages listed below, or by using the keyword search tool below to find specific information within the annual report.-
 1
1 -
2
-
3
-
4
-
5
-
6
-
7
-
8
-
9
-
10
-
11
-
12
-
13
-
14
-
15
-
16
-
 17
17 -
 18
18 -
 19
19 -
 20
20 -
 21
21 -
 22
22 -
 23
23 -
 24
24 -
 25
25 -
 26
26 -
 27
27 -
 28
28 -
 29
29 -
 30
30 -
 31
31 -
 32
32 -
 33
33 -
 34
34 -
 35
35 -
 36
36 -
 37
37 -
38
-
39
-
40
-
41
-
42
-
43
-
44
-
45
-
46
-
47
-
48
-
49
-
50
-
51
-
52
-
53
-
54
-
55
-
56
-
57
-
58
-
59
-
60
-
61
-
62
-
63
-
64
-
65
-
66
-
67
-
68
-
69
-
70
-
71
-
72
-
73
-
74
-
75
-
76
-
77
-
78
-
79
-
80
-
81
-
82
-
83
-
84
-
85
-
86
-
87
-
88
-
89
-
90
-
91
-
92
-
93
-
94
-
95
-
96
-
97
-
98
-
99
-
100
-
101
-
102
-
103
-
104
-
105
-
106
-
107
-
108
-
109
-
110
-
111
-
112
-
113
-
114
-
115
-
116
-
117
-
118
-
119
-
120
-
121
-
122
-
123
-
124
-
125
-
126
-
127
-
128
-
129
-
130
-
131
-
132
-
133
-
134
-
135
-
136
-
137
-
138
-
139
-
140
-
141
-
142
-
143
-
144
-
145
-
146
-
147
-
148
-
149
-
150
-
151
-
152
-
153
-
154
-
155
-
156
-
157
-
158
-
159
-
160
-
161
-
162
-
163
-
164
-
165
-
166
-
167
-
168
-
169
-
170
-
171
-
172
-
173
-
174
-
175
-
176
-
177
-
178
-
179
-
180
-
181
-
182
-
183
-
184
-
185
-
186
-
187
-
188
-
189
-
190
-
191
-
192
-
193
-
194
-
195
-
196
-
197
-
198
-
199
 |
 |
25
2013/14 Annual Report Lenovo Group Limited
FINANCIAL POSITION
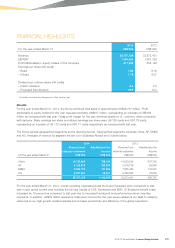
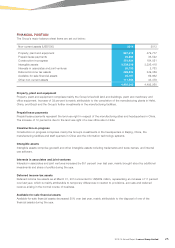
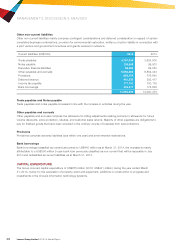
The Group’s major balance sheet items are set out below:
Non-current assets (US$’000) 2014 2013
Property, plant and equipment 667,413 479,777
Prepaid lease payments 40,884 36,522
Construction-in-progress 351,934 184,051
Intangible assets 3,339,516 3,326,418
Interests in associates and joint ventures 20,753 2,763
Deferred income tax assets 389,330 349,389
Available-for-sale financial assets 35,157 69,962
Other non-current assets 111,558 43,378
4,956,545 4,492,260
Property, plant and equipment
Property, plant and equipment comprises mainly the Group’s freehold land and buildings, plant and machinery and
office equipment. Increase of 39 percent is mainly attributable to the completion of the manufacturing plants in Hefei,
China, and Brazil and the Group’s further investments in the manufacturing facilities.
Prepaid lease payments
Prepaid lease payments represent the land use right in respect of the manufacturing sites and headquarters in China.
The increase of 12 percent is due to the land use right of a new office site in Hefei.
Construction-in-progress
Construction-in-progress comprises mainly the Group’s investments in the headquarters in Beijing, China, the
manufacturing facilities and staff quarters in China and the information technology systems.
Intangible assets
Intangible assets comprise goodwill and other intangible assets including trademarks and trade names, and internal
use software.
Interests in associates and joint ventures
Interests in associates and joint ventures increased by 651 percent over last year, mainly brought about by additional
investments and share of profits during the year.
Deferred income tax assets
Deferred income tax assets as at March 31, 2014 amounted to US$389 million, representing an increase of 11 percent
over last year, which is mainly attributable to temporary differences in relation to provisions, accruals and deferred
revenue arising in the normal course of business.
Available-for-sale financial assets
Available-for-sale financial assets decreased 50% over last year, mainly attributable to the disposal of one of the
financial assets during the year.