Lenovo 2014 Annual Report Download - page 29
Download and view the complete annual report
Please find page 29 of the 2014 Lenovo annual report below. You can navigate through the pages in the report by either clicking on the pages listed below, or by using the keyword search tool below to find specific information within the annual report.-
 1
1 -
2
-
3
-
4
-
5
-
6
-
7
-
8
-
9
-
10
-
11
-
12
-
13
-
14
-
15
-
16
-
17
-
18
-
 19
19 -
 20
20 -
 21
21 -
 22
22 -
 23
23 -
 24
24 -
 25
25 -
 26
26 -
 27
27 -
 28
28 -
 29
29 -
 30
30 -
 31
31 -
 32
32 -
 33
33 -
 34
34 -
 35
35 -
 36
36 -
 37
37 -
 38
38 -
 39
39 -
40
-
41
-
42
-
43
-
44
-
45
-
46
-
47
-
48
-
49
-
50
-
51
-
52
-
53
-
54
-
55
-
56
-
57
-
58
-
59
-
60
-
61
-
62
-
63
-
64
-
65
-
66
-
67
-
68
-
69
-
70
-
71
-
72
-
73
-
74
-
75
-
76
-
77
-
78
-
79
-
80
-
81
-
82
-
83
-
84
-
85
-
86
-
87
-
88
-
89
-
90
-
91
-
92
-
93
-
94
-
95
-
96
-
97
-
98
-
99
-
100
-
101
-
102
-
103
-
104
-
105
-
106
-
107
-
108
-
109
-
110
-
111
-
112
-
113
-
114
-
115
-
116
-
117
-
118
-
119
-
120
-
121
-
122
-
123
-
124
-
125
-
126
-
127
-
128
-
129
-
130
-
131
-
132
-
133
-
134
-
135
-
136
-
137
-
138
-
139
-
140
-
141
-
142
-
143
-
144
-
145
-
146
-
147
-
148
-
149
-
150
-
151
-
152
-
153
-
154
-
155
-
156
-
157
-
158
-
159
-
160
-
161
-
162
-
163
-
164
-
165
-
166
-
167
-
168
-
169
-
170
-
171
-
172
-
173
-
174
-
175
-
176
-
177
-
178
-
179
-
180
-
181
-
182
-
183
-
184
-
185
-
186
-
187
-
188
-
189
-
190
-
191
-
192
-
193
-
194
-
195
-
196
-
197
-
198
-
199
 |
 |
27
2013/14 Annual Report Lenovo Group Limited
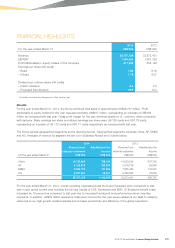
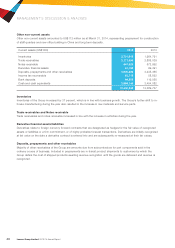
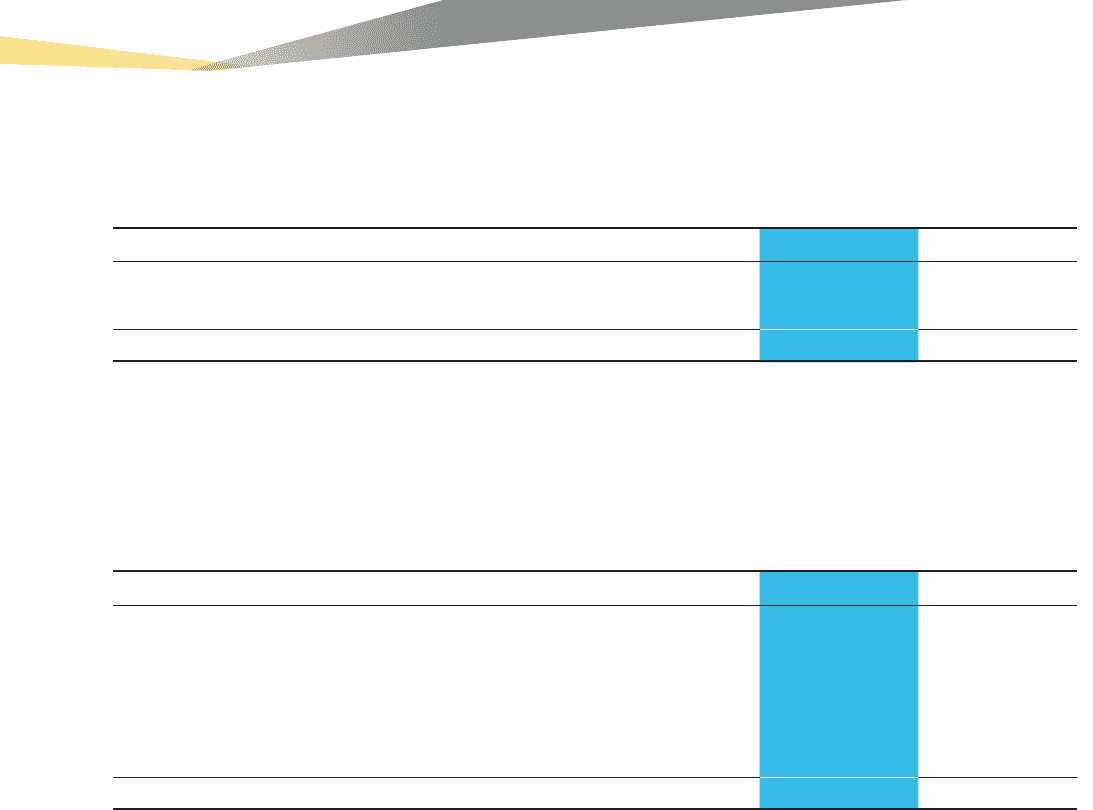
Equity attributable to owners of the Company (US$’000) 2014 2013
Share capital 1,650,101 33,465
Reserves 1,360,029 2,633,178
3,010,130 2,666,643
Share capital
Share capital amounted to US$1,650 million as at March 31, 2014. The increase in share capital is due to an entirely
new Companies Ordinance (Cap.622) (“new CO”) that came into effect on March 3, 2014. The new CO abolishes
authorized share capital, par value, share premium, and capital redemption reserve, in respect of the share capital of
Hong Kong companies. As a result, the amounts of share premium and share redemption reserve of the Company,
totaling US$1,616 million, are transferred to the share capital.
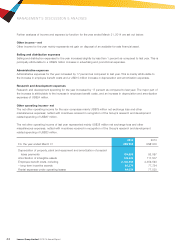
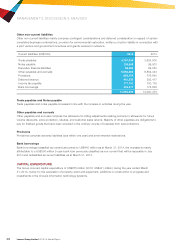
Non-current liabilities (US$’000) 2014 2013
Bank borrowings 10,125 303,133
Warranty provision 277,231 279,255
Deferred revenue 438,385 403,540
Retirement benefit obligations 156,515 163,883
Deferred income tax liabilities 142,881 113,992
Other non-current liabilities 844,914 846,539
1,870,051 2,110,342
Bank borrowings
Bank borrowings (classified as non-current) decreased by US$293 million mainly due to the reclassification of a
US$300 million 5-year loan facility obtained in 2009 that was subsequently drawn down and will be repayable in July
2014 as current liabilities as at March 31, 2014.
Warranty provision
The Group records warranty liabilities at the time of sale for the estimated costs that will be incurred under its basic
limited warranty. The specific warranty terms and conditions vary depending upon the product and the country in which
it was sold, but generally include technical support, repair parts and labor associated with warranty repair and service
actions. The period ranges from one to three years. The aggregate current and non-current amounts of warranty
provision increased by 7 percent when compared with last year, which is in line with business growth during the year.
The Group reevaluates its estimates on a quarterly basis to assess the adequacy of its recorded warranty liabilities and
adjusts the amounts as necessary.
Retirement benefit obligations
The Group operates various pension schemes. The schemes are generally funded through payments to insurance
companies or trustee-administered funds, determined by periodic actuarial calculations. The Group has both defined
benefit and defined contribution plans.
Deferred income tax liabilities
Deferred income tax liabilities comprise withholding tax on undistributed earnings, tax liabilities on upward valuation of
intangibles arising from business combination and accelerated tax depreciation.