Lenovo 2014 Annual Report Download - page 147
Download and view the complete annual report
Please find page 147 of the 2014 Lenovo annual report below. You can navigate through the pages in the report by either clicking on the pages listed below, or by using the keyword search tool below to find specific information within the annual report.-
 1
1 -
2
-
3
-
4
-
5
-
6
-
7
-
8
-
9
-
10
-
11
-
12
-
13
-
14
-
15
-
16
-
17
-
18
-
19
-
20
-
21
-
22
-
23
-
24
-
25
-
26
-
27
-
28
-
29
-
30
-
31
-
32
-
33
-
34
-
35
-
36
-
37
-
38
-
39
-
40
-
41
-
42
-
43
-
44
-
45
-
46
-
47
-
48
-
49
-
50
-
51
-
52
-
53
-
54
-
55
-
56
-
57
-
58
-
59
-
60
-
61
-
62
-
63
-
64
-
65
-
66
-
67
-
68
-
69
-
70
-
71
-
72
-
73
-
74
-
75
-
76
-
77
-
78
-
79
-
80
-
81
-
82
-
83
-
84
-
85
-
86
-
87
-
88
-
89
-
90
-
91
-
92
-
93
-
94
-
95
-
96
-
97
-
98
-
99
-
100
-
101
-
102
-
103
-
104
-
105
-
106
-
107
-
108
-
109
-
110
-
111
-
112
-
113
-
114
-
115
-
116
-
117
-
118
-
119
-
120
-
121
-
122
-
123
-
124
-
125
-
126
-
127
-
128
-
129
-
130
-
131
-
132
-
133
-
134
-
135
-
136
-
 137
137 -
 138
138 -
 139
139 -
 140
140 -
 141
141 -
 142
142 -
 143
143 -
 144
144 -
 145
145 -
 146
146 -
 147
147 -
 148
148 -
 149
149 -
 150
150 -
 151
151 -
 152
152 -
 153
153 -
 154
154 -
 155
155 -
 156
156 -
 157
157 -
158
-
159
-
160
-
161
-
162
-
163
-
164
-
165
-
166
-
167
-
168
-
169
-
170
-
171
-
172
-
173
-
174
-
175
-
176
-
177
-
178
-
179
-
180
-
181
-
182
-
183
-
184
-
185
-
186
-
187
-
188
-
189
-
190
-
191
-
192
-
193
-
194
-
195
-
196
-
197
-
198
-
199
 |
 |

145
2013/14 Annual Report Lenovo Group Limited
2 Significant accounting policies (continued)
(ab) Dividend distribution
Dividend distribution to the Company’s shareholders is recognized as a liability in the Group’s and Company’s financial
statements in the period in which the dividends are approved by the Company’s shareholders in case of final dividend and
by the Company’s directors in case of interim dividend.
3 Financial risk management
The Group’s activities expose it to a variety of financial risks, such as market risk (including foreign currency risk and cash
flow interest rate risk), credit risk, and liquidity risk. The Group’s overall financial risk management program focuses on the
unpredictability of financial markets and seeks to minimize potential adverse effects on the Group’s financial performance. The
Group uses derivative financial instruments to hedge certain risk exposures. Financial risk management is carried out by the
centralized treasury department (“Group Treasury”).
(a) Financial risk factors
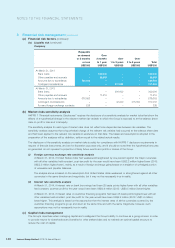
(i) Foreign currency risk
The Group operates internationally and is exposed to foreign currency risk arising from various currency exposures,
primarily with respect to United States dollar, Renminbi and Euro. Foreign currency risk arises from future commercial
transactions, recognized assets and liabilities and net investment in foreign operations denominated in a currency
that is not the group companies’ functional currency.
Management has set up a policy to require group companies to manage their foreign currency risk against their
functional currency. The Group’s forward foreign currency contracts are either used to hedge a percentage of
anticipated cash flows (mainly export sales and purchase of inventories) which are highly probable, or used as fair
value hedges for the identified assets and liabilities.
For segment reporting purposes, external hedge contracts on assets, liabilities or future transactions are designated
to each operating segment, as appropriate.
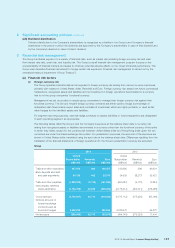
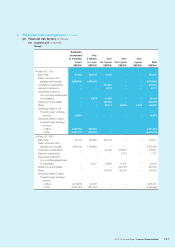
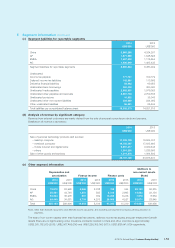
The following tables detail the Group’s and the Company’s exposure at the balance sheet date to currency risk
arising from recognized assets or liabilities denominated in a currency other than the functional currency of the entity
to which they relate, except for the currency risk between United States dollar and Hong Kong dollar given the two
currencies are under the linked exchange rate system. For presentation purposes, the amounts of the exposure are
shown in United States dollar, translated using the spot rate at the balance sheet date. Differences resulting from the
translation of the financial statements of foreign operations into the Group’s presentation currency are excluded.
Group
2014 2013
United
States dollar Renminbi Euro
United
States dollar Renminbi Euro
US$’000 US$’000 US$’000 US$’000 US$’000 US$’000
Trade and other receivables 237,972 868 134,557 233,980 396 80,431
Bank deposits and cash
and cash equivalents 94,725 942 23,513 24,609 38,273 33,421
Trade and other payables (1,288,099) (2,739) (167,550) (600,487) (4,176) (3,552)
Intercompany balances
before elimination (1,784,195) 43,639 (305,352) (2,173,214) (309,721) (193,468)
Gross exposure (2,739,597) 42,710 (314,832) (2,515,112) (275,228) (83,168)
Notional amounts of
forward exchange
contracts used as
economic hedges 2,480,232 –230,954 2,020,972 –94,572
Net exposure (259,365) 42,710 (83,878) (494,140) (275,228) 11,404