Lenovo 2014 Annual Report Download - page 151
Download and view the complete annual report
Please find page 151 of the 2014 Lenovo annual report below. You can navigate through the pages in the report by either clicking on the pages listed below, or by using the keyword search tool below to find specific information within the annual report.-
 1
1 -
2
-
3
-
4
-
5
-
6
-
7
-
8
-
9
-
10
-
11
-
12
-
13
-
14
-
15
-
16
-
17
-
18
-
19
-
20
-
21
-
22
-
23
-
24
-
25
-
26
-
27
-
28
-
29
-
30
-
31
-
32
-
33
-
34
-
35
-
36
-
37
-
38
-
39
-
40
-
41
-
42
-
43
-
44
-
45
-
46
-
47
-
48
-
49
-
50
-
51
-
52
-
53
-
54
-
55
-
56
-
57
-
58
-
59
-
60
-
61
-
62
-
63
-
64
-
65
-
66
-
67
-
68
-
69
-
70
-
71
-
72
-
73
-
74
-
75
-
76
-
77
-
78
-
79
-
80
-
81
-
82
-
83
-
84
-
85
-
86
-
87
-
88
-
89
-
90
-
91
-
92
-
93
-
94
-
95
-
96
-
97
-
98
-
99
-
100
-
101
-
102
-
103
-
104
-
105
-
106
-
107
-
108
-
109
-
110
-
111
-
112
-
113
-
114
-
115
-
116
-
117
-
118
-
119
-
120
-
121
-
122
-
123
-
124
-
125
-
126
-
127
-
128
-
129
-
130
-
131
-
132
-
133
-
134
-
135
-
136
-
137
-
138
-
139
-
140
-
 141
141 -
 142
142 -
 143
143 -
 144
144 -
 145
145 -
 146
146 -
 147
147 -
 148
148 -
 149
149 -
 150
150 -
 151
151 -
 152
152 -
 153
153 -
 154
154 -
 155
155 -
 156
156 -
 157
157 -
 158
158 -
 159
159 -
 160
160 -
 161
161 -
162
-
163
-
164
-
165
-
166
-
167
-
168
-
169
-
170
-
171
-
172
-
173
-
174
-
175
-
176
-
177
-
178
-
179
-
180
-
181
-
182
-
183
-
184
-
185
-
186
-
187
-
188
-
189
-
190
-
191
-
192
-
193
-
194
-
195
-
196
-
197
-
198
-
199
 |
 |

149
2013/14 Annual Report Lenovo Group Limited
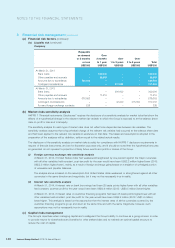
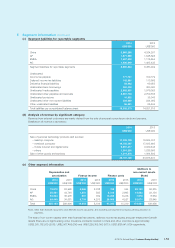
3 Financial risk management (continued)
(c) Capital risks management (continued)
In order to maintain or adjust the capital structure, the Group may adjust the amount of dividends paid to shareholders,
return capital to shareholders, issue new shares or sell assets to reduce debt.
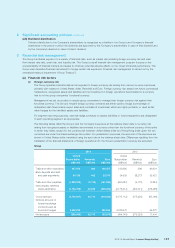
Consistent with others in the industry, the Group monitors capital on the basis of gearing ratio. This ratio is calculated
as total borrowings (including current and non-current borrowings) divided by total equity. The Group’s strategy remains
unchanged and the gearing ratios and net cash position of the Group as at March 31, 2014 and 2013 are as follows:
2014 2013
US$ million US$ million
Bank deposits and cash and cash equivalents 3,953 3,573
Less: total borrowings (455) (479)
Net cash position 3,498 3,094
Total equity 3,025 2,680
Gearing ratio 0.15 0.18
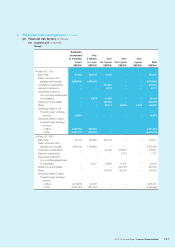
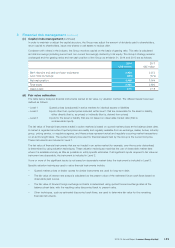
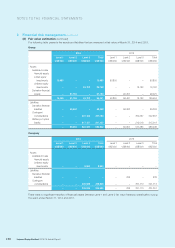
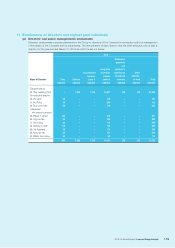
(d) Fair value estimation
The table below analyzes financial instruments carried at fair value, by valuation method. The different levels have been
defined as follows:
– Level 1 Quoted prices (unadjusted) in active markets for identical assets or liabilities
– Level 2 Inputs other than quoted prices included within level 1 that are observable for the asset or liability,
either directly (that is, as prices) or indirectly (that is, derived from prices)
– Level 3 Inputs for the asset or liability that are not based on observable market data (that is,
unobservable inputs)
The fair value of financial instruments traded in active markets is based on quoted market prices at the balance sheet date.
A market is regarded as active if quoted prices are readily and regularly available from an exchange, dealer, broker, industry
group, pricing service, or regulatory agency, and those prices represent actual and regularly occurring market transactions
on an arm’s length basis. The quoted market price used for financial assets held by the Group is the current bid price.
These instruments are included in Level 1.
The fair value of financial instruments that are not traded in an active market (for example, over-the-counter derivatives)
is determined by using valuation techniques. These valuation techniques maximize the use of observable market data
where it is available and rely as little as possible on entity specific estimates. If all significant inputs required to fair value an
instrument are observable, the instrument is included in Level 2.
If one or more of the significant inputs is not based on observable market data, the instrument is included in Level 3.
Specific valuation techniques used to value financial instruments include:
– Quoted market prices or dealer quotes for similar instruments are used for long-term debt.
– The fair value of interest rate swaps is calculated as the present value of the estimated future cash flows based on
observable yield curves.
– The fair value of forward foreign exchange contracts is determined using quoted forward exchange rates at the
balance sheet date, with the resulting value discounted back to present value.
– Other techniques, such as estimated discounted cash flows, are used to determine fair value for the remaining
financial instruments.