Lenovo 2014 Annual Report Download - page 20
Download and view the complete annual report
Please find page 20 of the 2014 Lenovo annual report below. You can navigate through the pages in the report by either clicking on the pages listed below, or by using the keyword search tool below to find specific information within the annual report.-
 1
1 -
2
-
3
-
4
-
5
-
6
-
7
-
8
-
9
-
 10
10 -
 11
11 -
 12
12 -
 13
13 -
 14
14 -
 15
15 -
 16
16 -
 17
17 -
 18
18 -
 19
19 -
 20
20 -
 21
21 -
 22
22 -
 23
23 -
 24
24 -
 25
25 -
 26
26 -
 27
27 -
 28
28 -
 29
29 -
 30
30 -
31
-
32
-
33
-
34
-
35
-
36
-
37
-
38
-
39
-
40
-
41
-
42
-
43
-
44
-
45
-
46
-
47
-
48
-
49
-
50
-
51
-
52
-
53
-
54
-
55
-
56
-
57
-
58
-
59
-
60
-
61
-
62
-
63
-
64
-
65
-
66
-
67
-
68
-
69
-
70
-
71
-
72
-
73
-
74
-
75
-
76
-
77
-
78
-
79
-
80
-
81
-
82
-
83
-
84
-
85
-
86
-
87
-
88
-
89
-
90
-
91
-
92
-
93
-
94
-
95
-
96
-
97
-
98
-
99
-
100
-
101
-
102
-
103
-
104
-
105
-
106
-
107
-
108
-
109
-
110
-
111
-
112
-
113
-
114
-
115
-
116
-
117
-
118
-
119
-
120
-
121
-
122
-
123
-
124
-
125
-
126
-
127
-
128
-
129
-
130
-
131
-
132
-
133
-
134
-
135
-
136
-
137
-
138
-
139
-
140
-
141
-
142
-
143
-
144
-
145
-
146
-
147
-
148
-
149
-
150
-
151
-
152
-
153
-
154
-
155
-
156
-
157
-
158
-
159
-
160
-
161
-
162
-
163
-
164
-
165
-
166
-
167
-
168
-
169
-
170
-
171
-
172
-
173
-
174
-
175
-
176
-
177
-
178
-
179
-
180
-
181
-
182
-
183
-
184
-
185
-
186
-
187
-
188
-
189
-
190
-
191
-
192
-
193
-
194
-
195
-
196
-
197
-
198
-
199
 |
 |

18 Lenovo Group Limited 2013/14 Annual Report
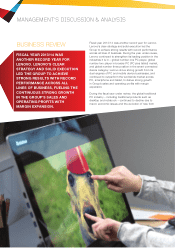
MANAGEMENT’S DISCUSSION & ANALYSIS
growth in China and emerging markets outside of China.
For the fiscal year, Lenovo maintained its position as the
number four smartphone vendor in the world with market
share increased by one point to 4.6 percent, according to
preliminary industry estimates.
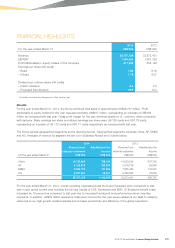
For the fiscal year ended March 31, 2014, the Group’s
consolidated revenue increased by 14 percent year-on-
year to record-high US$38,707 million. Revenue of the
Group’s PC and related business were US$31,835 million,
representing a year-on-year increase of 7 percent; whilst
the revenue of mobile devices increased 86 percent year-
on-year to US$5,657 million. Meanwhile, revenue of other
goods and services was US$1,215 million.
The Group’s gross profit increased by 14 percent year-
on-year to US$5,064 million and gross margin remained
flat year-on-year at 13.1 percent.
Operating expenses increased by 11 percent year-on-
year to US$4,012 million, with an expenses-to-revenue
ratio of 10.4 percent. The Group achieved record-high
performance in profit before taxation (“PTI”) and profit
attributable to equity holders of the Company. Its PTI
reached US$1,014 million, the first time Group’s PTI
exceeded US$1 billion level, and profit attributable to
equity holders of the Company amounted to US$817
million, representing an increase of 27 percent and 29
percent respectively from the previous fiscal year.
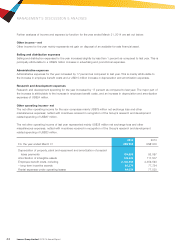
PERFORMANCE OF GEOGRAPHIES
During the year ended March 31, 2014, Lenovo achieved
record-high market shares in all geographies where it has
operations – China, Asia Pacific (“AP”), Americas (“AG”)
and Europe-Middle East-Africa (“EMEA”) – with solid and
balanced performances across product and customer
segments.
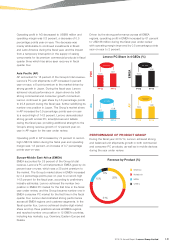
Revenue by Geography (%)
FY13/14
FY12/13
ChinaAGAPEMEA
0% 20% 40% 60% 80%
100%
38%
43%
21%
19%
16%
16%
25%
22%
China
China accounted for 38 percent of the Group’s total
revenue. Despite the softness in the PC market due to
macro economic issues, Lenovo continued to outperform
in the China PC market through its solid execution and
strong brand and distribution channel network. The Group
maintained its strong number one position with market
share gain of 0.6 point year-on-year to record-high 35.1
percent, and continued to improve its profitability by
leveraging its leadership position.
The Group’s efforts in driving both PC and mobile
device businesses continued to work well during the
period under review, and the Group’s smartphone and
tablet businesses in China continued to post strong unit
shipments growth with share gains over the last year.
This strong growth from the smartphone and tablet
businesses fueled the Group’s China revenue growth of
1 percent year-on-year to US$14,725 million during the
period under review. Operating profit increased by 22
percent to US$788 million and operating margin was 5.4
percent, increasing by 0.9 percentage points year-on-year
due to margin improvement in both PC and mobile device
businesses. Operating margin for the China PC business
was 6.9 percent, up 1 percentage point year-on-year,
benefiting from its strong product mix with improved
average selling price and stringent expense control.
Americas (AG)
AG accounted for 21 percent of the Group’s total revenue
driven by growth across all products. Lenovo’s PC unit
shipments in AG grew by 27 percent year-on-year, a
32-point premium to the market driven by strong growth
in both consumer and commercial businesses. The
Group’s market share increased by 2.7 percentage points
from a year ago to a record-high 10.9 percent, helping
the Group maintain its number three position in the AG
PC market, according to preliminary industry estimates.
Lenovo further increased its market share in North
America by 1.7 percentage points to 10.5 percent, and in
fiscal quarter four, the Group became number three in the
U.S. PC market for the first time and achieved double-
digit share at 10.8 percent, driven by its strong growth
in both commercial and consumer businesses. Lenovo
continued to build its foundation in Brazil, achieving
record-high market share at 15.1 percent, up 10.8
percentage points from last year.