Lenovo 2014 Annual Report Download - page 197
Download and view the complete annual report
Please find page 197 of the 2014 Lenovo annual report below. You can navigate through the pages in the report by either clicking on the pages listed below, or by using the keyword search tool below to find specific information within the annual report.-
 1
1 -
2
-
3
-
4
-
5
-
6
-
7
-
8
-
9
-
10
-
11
-
12
-
13
-
14
-
15
-
16
-
17
-
18
-
19
-
20
-
21
-
22
-
23
-
24
-
25
-
26
-
27
-
28
-
29
-
30
-
31
-
32
-
33
-
34
-
35
-
36
-
37
-
38
-
39
-
40
-
41
-
42
-
43
-
44
-
45
-
46
-
47
-
48
-
49
-
50
-
51
-
52
-
53
-
54
-
55
-
56
-
57
-
58
-
59
-
60
-
61
-
62
-
63
-
64
-
65
-
66
-
67
-
68
-
69
-
70
-
71
-
72
-
73
-
74
-
75
-
76
-
77
-
78
-
79
-
80
-
81
-
82
-
83
-
84
-
85
-
86
-
87
-
88
-
89
-
90
-
91
-
92
-
93
-
94
-
95
-
96
-
97
-
98
-
99
-
100
-
101
-
102
-
103
-
104
-
105
-
106
-
107
-
108
-
109
-
110
-
111
-
112
-
113
-
114
-
115
-
116
-
117
-
118
-
119
-
120
-
121
-
122
-
123
-
124
-
125
-
126
-
127
-
128
-
129
-
130
-
131
-
132
-
133
-
134
-
135
-
136
-
137
-
138
-
139
-
140
-
141
-
142
-
143
-
144
-
145
-
146
-
147
-
148
-
149
-
150
-
151
-
152
-
153
-
154
-
155
-
156
-
157
-
158
-
159
-
160
-
161
-
162
-
163
-
164
-
165
-
166
-
167
-
168
-
169
-
170
-
171
-
172
-
173
-
174
-
175
-
176
-
177
-
178
-
179
-
180
-
181
-
182
-
183
-
184
-
185
-
186
-
 187
187 -
 188
188 -
 189
189 -
 190
190 -
 191
191 -
 192
192 -
 193
193 -
 194
194 -
 195
195 -
 196
196 -
 197
197 -
 198
198 -
 199
199
 |
 |
195
2013/14 Annual Report Lenovo Group Limited
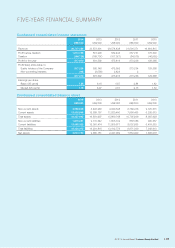
FIVE-YEAR FINANCIAL SUMMARY
Condensed consolidated income statement
2014 2013 2012 2011 2010
US$’000 US$’000 US$’000 US$’000 US$’000
Revenue 38,707,129 33,873,401 29,574,438 21,594,371 16,604,815
Profit before taxation 1,014,195 801,299 582,443 357,751 176,303
Taxation (196,725) (169,707) (107,027) (84,515) (46,935)
Profit for the year 817,470 631,592 475,416 273,236 129,368
Profit/(loss) attributable to:
Equity holders of the Company 817,228 635,148 472,992 273,234 129,368
Non-controlling interests 242 (3,556) 2,424 2 –
817,470 631,592 475,416 273,236 129,368
Earnings per share
Basic (US cents) 7.88 6.16 4.67 2.84 1.42
Diluted (US cents) 7.78 6.07 4.57 2.73 1.33
Condensed consolidated balance sheet
2014 2013 2012 2011 2010
US$’000 US$’000 US$’000 US$’000 US$’000
Non-current assets 4,956,545 4,492,260 4,040,348 2,769,476 2,720,315
Current assets 13,400,548 12,389,737 11,820,400 7,936,463 6,235,613
Total assets 18,357,093 16,881,997 15,860,748 10,705,939 8,955,928
Non-current liabilities 1,870,051 2,110,342 1,603,102 838,386 930,557
Current liabilities 13,462,322 12,091,474 11,809,677 8,032,653 6,419,353
Total liabilities 15,332,373 14,201,816 13,412,779 8,871,039 7,349,910
Net assets 3,024,720 2,680,181 2,447,969 1,834,900 1,606,018