Lenovo 2014 Annual Report Download - page 158
Download and view the complete annual report
Please find page 158 of the 2014 Lenovo annual report below. You can navigate through the pages in the report by either clicking on the pages listed below, or by using the keyword search tool below to find specific information within the annual report.-
 1
1 -
2
-
3
-
4
-
5
-
6
-
7
-
8
-
9
-
10
-
11
-
12
-
13
-
14
-
15
-
16
-
17
-
18
-
19
-
20
-
21
-
22
-
23
-
24
-
25
-
26
-
27
-
28
-
29
-
30
-
31
-
32
-
33
-
34
-
35
-
36
-
37
-
38
-
39
-
40
-
41
-
42
-
43
-
44
-
45
-
46
-
47
-
48
-
49
-
50
-
51
-
52
-
53
-
54
-
55
-
56
-
57
-
58
-
59
-
60
-
61
-
62
-
63
-
64
-
65
-
66
-
67
-
68
-
69
-
70
-
71
-
72
-
73
-
74
-
75
-
76
-
77
-
78
-
79
-
80
-
81
-
82
-
83
-
84
-
85
-
86
-
87
-
88
-
89
-
90
-
91
-
92
-
93
-
94
-
95
-
96
-
97
-
98
-
99
-
100
-
101
-
102
-
103
-
104
-
105
-
106
-
107
-
108
-
109
-
110
-
111
-
112
-
113
-
114
-
115
-
116
-
117
-
118
-
119
-
120
-
121
-
122
-
123
-
124
-
125
-
126
-
127
-
128
-
129
-
130
-
131
-
132
-
133
-
134
-
135
-
136
-
137
-
138
-
139
-
140
-
141
-
142
-
143
-
144
-
145
-
146
-
147
-
 148
148 -
 149
149 -
 150
150 -
 151
151 -
 152
152 -
 153
153 -
 154
154 -
 155
155 -
 156
156 -
 157
157 -
 158
158 -
 159
159 -
 160
160 -
 161
161 -
 162
162 -
 163
163 -
 164
164 -
 165
165 -
 166
166 -
 167
167 -
 168
168 -
169
-
170
-
171
-
172
-
173
-
174
-
175
-
176
-
177
-
178
-
179
-
180
-
181
-
182
-
183
-
184
-
185
-
186
-
187
-
188
-
189
-
190
-
191
-
192
-
193
-
194
-
195
-
196
-
197
-
198
-
199
 |
 |
156 Lenovo Group Limited 2013/14 Annual Report
NOTES TO THE FINANCIAL STATEMENTS
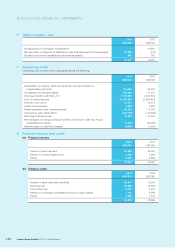
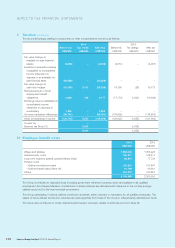
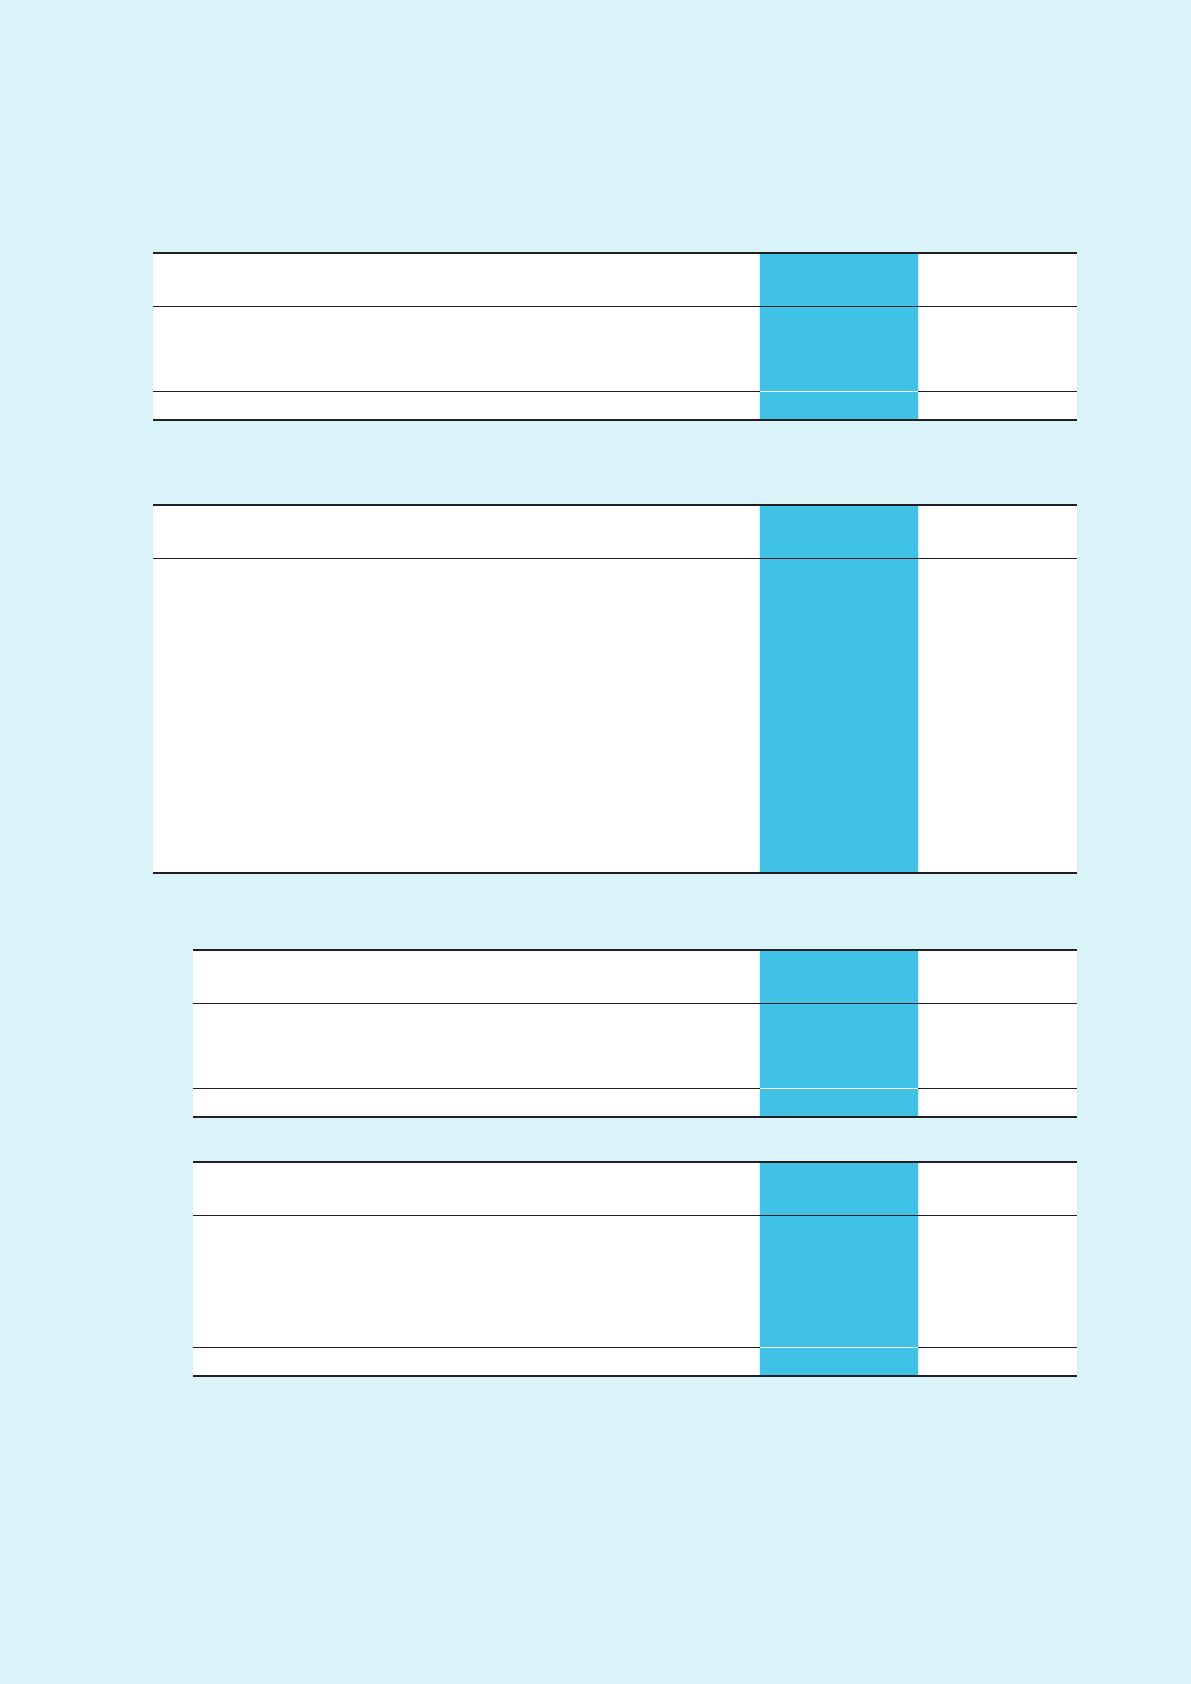
6 Other income – net
2014 2013
US$’000 US$’000
De-recognition of contingent consideration –19,861
Net gain/(loss) on disposal of available-for-sale financial assets and investments 21,880 (316)
Dividend income from available-for-sale financial assets 547 362
22,427 19,907
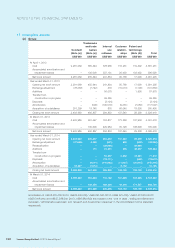
7 Operating profit
Operating profit is stated after charging/(crediting) the following:
2014 2013
US$’000 US$’000
Depreciation of property, plant and equipment and amortization of
prepaid lease payments 109,689 92,097
Amortization of intangible assets 145,444 117,507
Employee benefit costs (Note 10) 2,745,853 2,359,593
Cost of inventories sold 31,763,864 27,825,429
Inventory write-down 57,031 13,012
Auditor’s remuneration 4,543 5,567
Rental expenses under operating leases 99,024 77,530
Government grant (Note 29(iv)) (143,755) (115,366)
Net foreign exchange loss 79,242 37,634
Net loss/(gain) on foreign exchange forward contracts for cash flow hedge
reclassified from equity 10,818 (20,953)
Ineffectiveness on cash flow hedges (4,265) (3,581)
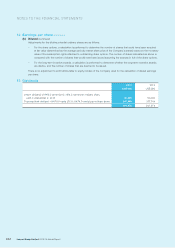
8 Finance income and costs
(a) Finance income
2014 2013
US$’000 US$’000
Interest on bank deposits 26,852 34,981
Interest on money market funds 2,126 3,004
Others 4,915 6,896
33,893 44,881
(b) Finance costs
2014 2013
US$’000 US$’000
Interest on bank loans and overdrafts 39,811 12,592
Factoring cost 23,866 14,358
Commitment fee 5,878 5,907
Interest on contingent considerations and put option liability 7,190 8,096
Others 4,229 1,916
80,974 42,869