Lenovo 2014 Annual Report Download - page 191
Download and view the complete annual report
Please find page 191 of the 2014 Lenovo annual report below. You can navigate through the pages in the report by either clicking on the pages listed below, or by using the keyword search tool below to find specific information within the annual report.-
 1
1 -
2
-
3
-
4
-
5
-
6
-
7
-
8
-
9
-
10
-
11
-
12
-
13
-
14
-
15
-
16
-
17
-
18
-
19
-
20
-
21
-
22
-
23
-
24
-
25
-
26
-
27
-
28
-
29
-
30
-
31
-
32
-
33
-
34
-
35
-
36
-
37
-
38
-
39
-
40
-
41
-
42
-
43
-
44
-
45
-
46
-
47
-
48
-
49
-
50
-
51
-
52
-
53
-
54
-
55
-
56
-
57
-
58
-
59
-
60
-
61
-
62
-
63
-
64
-
65
-
66
-
67
-
68
-
69
-
70
-
71
-
72
-
73
-
74
-
75
-
76
-
77
-
78
-
79
-
80
-
81
-
82
-
83
-
84
-
85
-
86
-
87
-
88
-
89
-
90
-
91
-
92
-
93
-
94
-
95
-
96
-
97
-
98
-
99
-
100
-
101
-
102
-
103
-
104
-
105
-
106
-
107
-
108
-
109
-
110
-
111
-
112
-
113
-
114
-
115
-
116
-
117
-
118
-
119
-
120
-
121
-
122
-
123
-
124
-
125
-
126
-
127
-
128
-
129
-
130
-
131
-
132
-
133
-
134
-
135
-
136
-
137
-
138
-
139
-
140
-
141
-
142
-
143
-
144
-
145
-
146
-
147
-
148
-
149
-
150
-
151
-
152
-
153
-
154
-
155
-
156
-
157
-
158
-
159
-
160
-
161
-
162
-
163
-
164
-
165
-
166
-
167
-
168
-
169
-
170
-
171
-
172
-
173
-
174
-
175
-
176
-
177
-
178
-
179
-
180
-
 181
181 -
 182
182 -
 183
183 -
 184
184 -
 185
185 -
 186
186 -
 187
187 -
 188
188 -
 189
189 -
 190
190 -
 191
191 -
 192
192 -
 193
193 -
 194
194 -
 195
195 -
 196
196 -
 197
197 -
 198
198 -
 199
199
 |
 |

189
2013/14 Annual Report Lenovo Group Limited
36 Retirement benefit obligations
(continued)
(c) Additional information on post-employment benefits (pension and medical)
(continued)
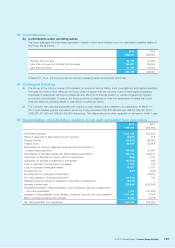
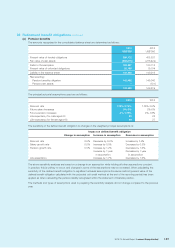
Expected maturity analysis of undiscounted pension and post-employments medical benefits:
At March 31, 2014
Less than
a year
Between
1-2 years
Between
2-5 years
Over
5 years Total
US$’000 US$’000 US$’000 US$’000 US$’000
Pension benefits 10,614 11,840 42,873 569,171 634,498
Post-employment medical benefits 3,328 3,630 2,562 22,238 31,758
Total 13,942 15,470 45,435 591,409 666,256
Pension and medical plan assets do not include any of the Company’s ordinary shares or US real estate occupied by the
Group (2013: Nil).
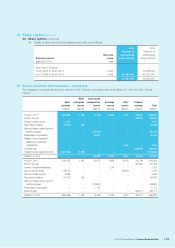
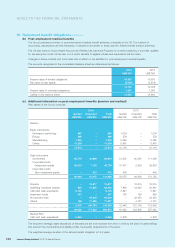
Reconciliation of fair value of plan assets of the Group:
Pension Medical
2014 2013 2014 2013
US$’000 US$’000 US$’000 US$’000
Opening fair value 275,422 224,497 5,878 6,445
Exchange adjustment (12,285) (17,494) (1) 10
Interest income 5,965 5,904 160 174
Remeasurements:
Return on plan assets
excluding interest income 1,015 888 ––
Experience (losses)/gains (281) 7,217 (146) (265)
Contributions by the employer 19,698 59,953 27 (90)
Contributions by plan
participants 415 167 –
Benefits paid (23,074) (5,710) (373) (396)
Closing fair value 266,875 275,422 5,545 5,878
Actual return on plan assets 6,699 14,009 14 (91)
Contributions of US$8,295,000 are estimated to be made for the year ending March 31, 2015.
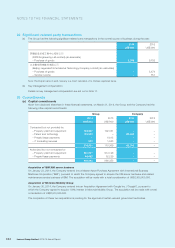
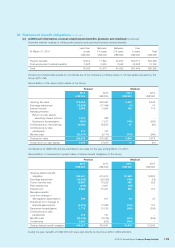
Reconciliation of movements in present value of defined benefit obligations of the Group:
Pension Medical
2014 2013 2014 2013
US$’000 US$’000 US$’000 US$’000
Opening defined benefit
obligation 424,641 415,910 20,542 19,850
Exchange adjustment (16,002) (36,259) (169) (79)
Current service cost 15,850 16,233 495 522
Past service cost (695) 2,031 (34) –
Interest cost 9,689 10,407 685 707
Remeasurements:
Loss from change in
demographic assumptions 509 911 69 33
(Gain)/loss from changes in
financial assumptions (4,614) 13,389 (678) 127
Experience losses/(gains) 1,779 10,763 (465) (209)
Contributions by plan
participants 415 167 ––
Benefits paid (25,135) (8,709) (373) (409)
Curtailments 2,920 (202) (494) –
Closing defined benefit obligation 409,357 424,641 19,578 20,542
During the year, benefits of US$2,061,000 were paid directly by the Group (2013: US$2,999,000).