Lenovo 2014 Annual Report Download - page 25
Download and view the complete annual report
Please find page 25 of the 2014 Lenovo annual report below. You can navigate through the pages in the report by either clicking on the pages listed below, or by using the keyword search tool below to find specific information within the annual report.-
 1
1 -
2
-
3
-
4
-
5
-
6
-
7
-
8
-
9
-
10
-
11
-
12
-
13
-
14
-
 15
15 -
 16
16 -
 17
17 -
 18
18 -
 19
19 -
 20
20 -
 21
21 -
 22
22 -
 23
23 -
 24
24 -
 25
25 -
 26
26 -
 27
27 -
 28
28 -
 29
29 -
 30
30 -
 31
31 -
 32
32 -
 33
33 -
 34
34 -
 35
35 -
36
-
37
-
38
-
39
-
40
-
41
-
42
-
43
-
44
-
45
-
46
-
47
-
48
-
49
-
50
-
51
-
52
-
53
-
54
-
55
-
56
-
57
-
58
-
59
-
60
-
61
-
62
-
63
-
64
-
65
-
66
-
67
-
68
-
69
-
70
-
71
-
72
-
73
-
74
-
75
-
76
-
77
-
78
-
79
-
80
-
81
-
82
-
83
-
84
-
85
-
86
-
87
-
88
-
89
-
90
-
91
-
92
-
93
-
94
-
95
-
96
-
97
-
98
-
99
-
100
-
101
-
102
-
103
-
104
-
105
-
106
-
107
-
108
-
109
-
110
-
111
-
112
-
113
-
114
-
115
-
116
-
117
-
118
-
119
-
120
-
121
-
122
-
123
-
124
-
125
-
126
-
127
-
128
-
129
-
130
-
131
-
132
-
133
-
134
-
135
-
136
-
137
-
138
-
139
-
140
-
141
-
142
-
143
-
144
-
145
-
146
-
147
-
148
-
149
-
150
-
151
-
152
-
153
-
154
-
155
-
156
-
157
-
158
-
159
-
160
-
161
-
162
-
163
-
164
-
165
-
166
-
167
-
168
-
169
-
170
-
171
-
172
-
173
-
174
-
175
-
176
-
177
-
178
-
179
-
180
-
181
-
182
-
183
-
184
-
185
-
186
-
187
-
188
-
189
-
190
-
191
-
192
-
193
-
194
-
195
-
196
-
197
-
198
-
199
 |
 |
23
2013/14 Annual Report Lenovo Group Limited
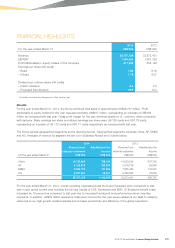
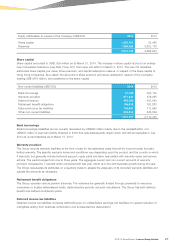
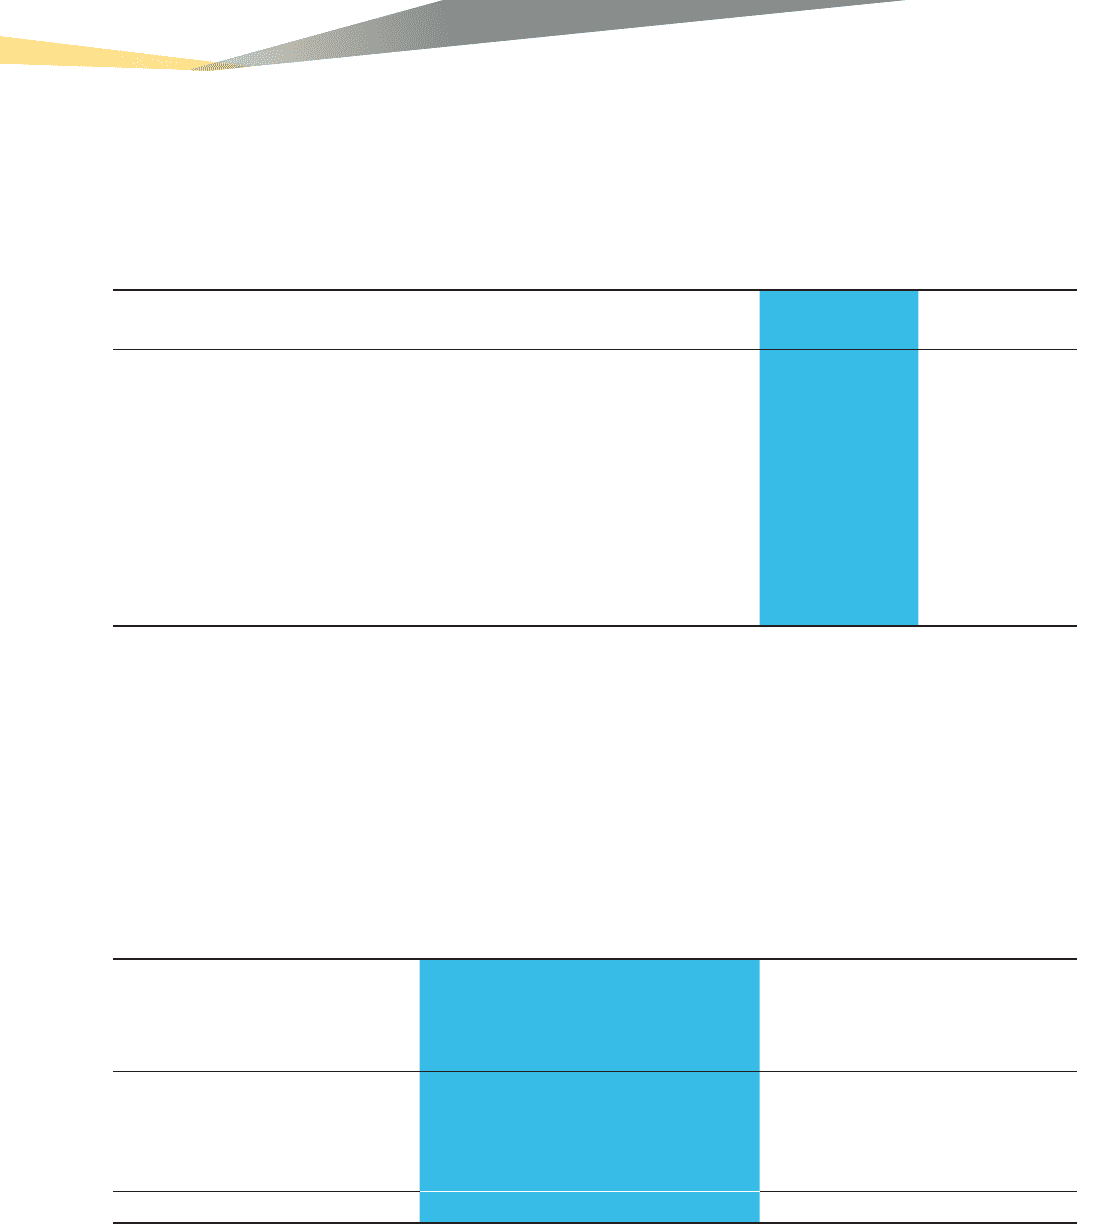
FINANCIAL HIGHLIGHTS
2014 2013
For the year ended March 31 US$’000 US$’000
Revenue 38,707,129 33,873,401
EBITDA* 1,365,061 1,067,339
Profit attributable to equity holders of the Company 817,228 635,148
Earnings per share (US cents)
– Basic 7.88 6.16
– Diluted 7.78 6.07
Dividend per ordinary share (HK cents)
– Interim dividend 6.0 4.5
– Proposed final dividend 18.0 14.0
* Excluding restructuring charges and other income, net
Results
For the year ended March 31, 2014, the Group achieved total sales of approximately US$38,707 million. Profit
attributable to equity holders for the year was approximately US$817 million, representing an increase of US$182
million as compared with last year. Gross profit margin for the year remained stable at 13.1 percent, when compared
with last year. Basic earnings per share and diluted earnings per share were US7.88 cents and US7.78 cents,
representing an increase of US1.72 cents and US1.71 cents respectively as compared with last year.
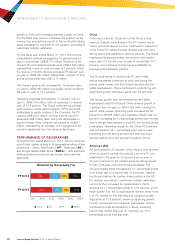
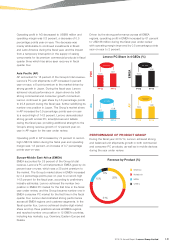
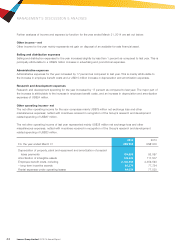
The Group adopts geographical segments as the reporting format. Geographical segments comprise China, AP, EMEA
and AG. Analyses of revenue by segment are set out in Business Review and Outlook below.
2014 2013
Revenue from
external customers
Adjusted pre-tax
income
Revenue from
external customers
Adjusted pre-tax
income
For the year ended March 31 US$’000 US$’000 US$’000 US$’000
China 14,725,659 788,130 14,538,534 647,702
AP 6,162,919 109,350 5,516,776 62,865
EMEA 9,580,700 187,482 7,535,483 116,591
AG 8,237,851 68,627 6,282,608 78,609
38,707,129 1,153,589 33,873,401 905,767
For the year ended March 31, 2014, overall operating expenses across the board increased when compared to last
year in part as the current year includes the full year results of CCE, Stoneware and EMC JV. Employee benefit costs
increased by 16 percent as compared to last year due to increased headcount and performance-driven incentive
payments. In addition, US$79 million severance costs were incurred for the year as we rebalance our skills to redeploy
resources to our high growth mobile business and increase productivity and efficiency of the global operations.