Lenovo 2014 Annual Report Download - page 126
Download and view the complete annual report
Please find page 126 of the 2014 Lenovo annual report below. You can navigate through the pages in the report by either clicking on the pages listed below, or by using the keyword search tool below to find specific information within the annual report.-
 1
1 -
2
-
3
-
4
-
5
-
6
-
7
-
8
-
9
-
10
-
11
-
12
-
13
-
14
-
15
-
16
-
17
-
18
-
19
-
20
-
21
-
22
-
23
-
24
-
25
-
26
-
27
-
28
-
29
-
30
-
31
-
32
-
33
-
34
-
35
-
36
-
37
-
38
-
39
-
40
-
41
-
42
-
43
-
44
-
45
-
46
-
47
-
48
-
49
-
50
-
51
-
52
-
53
-
54
-
55
-
56
-
57
-
58
-
59
-
60
-
61
-
62
-
63
-
64
-
65
-
66
-
67
-
68
-
69
-
70
-
71
-
72
-
73
-
74
-
75
-
76
-
77
-
78
-
79
-
80
-
81
-
82
-
83
-
84
-
85
-
86
-
87
-
88
-
89
-
90
-
91
-
92
-
93
-
94
-
95
-
96
-
97
-
98
-
99
-
100
-
101
-
102
-
103
-
104
-
105
-
106
-
107
-
108
-
109
-
110
-
111
-
112
-
113
-
114
-
115
-
 116
116 -
 117
117 -
 118
118 -
 119
119 -
 120
120 -
 121
121 -
 122
122 -
 123
123 -
 124
124 -
 125
125 -
 126
126 -
 127
127 -
 128
128 -
 129
129 -
 130
130 -
 131
131 -
 132
132 -
 133
133 -
 134
134 -
 135
135 -
 136
136 -
137
-
138
-
139
-
140
-
141
-
142
-
143
-
144
-
145
-
146
-
147
-
148
-
149
-
150
-
151
-
152
-
153
-
154
-
155
-
156
-
157
-
158
-
159
-
160
-
161
-
162
-
163
-
164
-
165
-
166
-
167
-
168
-
169
-
170
-
171
-
172
-
173
-
174
-
175
-
176
-
177
-
178
-
179
-
180
-
181
-
182
-
183
-
184
-
185
-
186
-
187
-
188
-
189
-
190
-
191
-
192
-
193
-
194
-
195
-
196
-
197
-
198
-
199
 |
 |
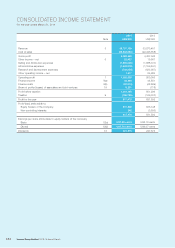
124 Lenovo Group Limited 2013/14 Annual Report
CONSOLIDATED INCOME STATEMENT
For the year ended March 31, 2014
2014 2013
Note US$’000 US$’000
Revenue 538,707,129 33,873,401
Cost of sales (33,643,480) (29,446,358)
Gross profit 5,063,649 4,427,043
Other income – net 622,427 19,907
Selling and distribution expenses (1,900,005) (1,888,101)
Administrative expenses (1,402,979) (1,199,841)
Research and development expenses (732,454) (623,987)
Other operating income – net 1,417 64,984
Operating profit 71,052,055 800,005
Finance income 8(a) 33,893 44,881
Finance costs 8(b) (80,974) (42,869)
Share of profits/(losses) of associates and joint ventures 19 9,221 (718)
Profit before taxation 1,014,195 801,299
Taxation 9(196,725) (169,707)
Profit for the year 817,470 631,592
Profit/(loss) attributable to:
Equity holders of the Company 817,228 635,148
Non-controlling interests 242 (3,556)
817,470 631,592
Earnings per share attributable to equity holders of the Company
Basic 12(a) US7.88 cents US6.16 cents
Diluted 12(b) US7.78 cents US6.07 cents
Dividends 13 321,875 247,674