Lenovo 2014 Annual Report Download - page 26
Download and view the complete annual report
Please find page 26 of the 2014 Lenovo annual report below. You can navigate through the pages in the report by either clicking on the pages listed below, or by using the keyword search tool below to find specific information within the annual report.-
 1
1 -
2
-
3
-
4
-
5
-
6
-
7
-
8
-
9
-
10
-
11
-
12
-
13
-
14
-
15
-
 16
16 -
 17
17 -
 18
18 -
 19
19 -
 20
20 -
 21
21 -
 22
22 -
 23
23 -
 24
24 -
 25
25 -
 26
26 -
 27
27 -
 28
28 -
 29
29 -
 30
30 -
 31
31 -
 32
32 -
 33
33 -
 34
34 -
 35
35 -
 36
36 -
37
-
38
-
39
-
40
-
41
-
42
-
43
-
44
-
45
-
46
-
47
-
48
-
49
-
50
-
51
-
52
-
53
-
54
-
55
-
56
-
57
-
58
-
59
-
60
-
61
-
62
-
63
-
64
-
65
-
66
-
67
-
68
-
69
-
70
-
71
-
72
-
73
-
74
-
75
-
76
-
77
-
78
-
79
-
80
-
81
-
82
-
83
-
84
-
85
-
86
-
87
-
88
-
89
-
90
-
91
-
92
-
93
-
94
-
95
-
96
-
97
-
98
-
99
-
100
-
101
-
102
-
103
-
104
-
105
-
106
-
107
-
108
-
109
-
110
-
111
-
112
-
113
-
114
-
115
-
116
-
117
-
118
-
119
-
120
-
121
-
122
-
123
-
124
-
125
-
126
-
127
-
128
-
129
-
130
-
131
-
132
-
133
-
134
-
135
-
136
-
137
-
138
-
139
-
140
-
141
-
142
-
143
-
144
-
145
-
146
-
147
-
148
-
149
-
150
-
151
-
152
-
153
-
154
-
155
-
156
-
157
-
158
-
159
-
160
-
161
-
162
-
163
-
164
-
165
-
166
-
167
-
168
-
169
-
170
-
171
-
172
-
173
-
174
-
175
-
176
-
177
-
178
-
179
-
180
-
181
-
182
-
183
-
184
-
185
-
186
-
187
-
188
-
189
-
190
-
191
-
192
-
193
-
194
-
195
-
196
-
197
-
198
-
199
 |
 |
24 Lenovo Group Limited 2013/14 Annual Report
MANAGEMENT’S DISCUSSION & ANALYSIS
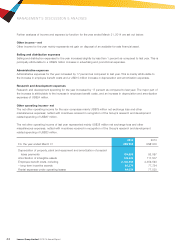
Further analyses of income and expense by function for the year ended March 31, 2014 are set out below:
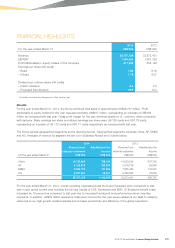
Other income – net
Other income for the year mainly represents net gain on disposal of an available-for-sale financial asset.
Selling and distribution expenses
Selling and distribution expenses for the year increased slightly by less than 1 percent as compared to last year. This is
principally attributable to a US$29 million increase in advertising and promotional expenses.
Administrative expenses
Administrative expenses for the year increased by 17 percent as compared to last year. This is mainly attributable to
the increase in employee benefit costs and a US$15 million increase in depreciation and amortization expenses.
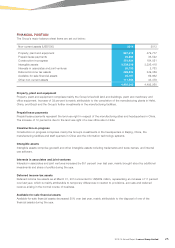
Research and development expenses
Research and development spending for the year increased by 17 percent as compared to last year. The major part of
the increase is attributable to the increase in employee benefit costs, and an increase in depreciation and amortization
expenses of US$24 million.
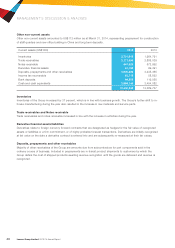
Other operating income- net
The net other operating income for the year comprises mainly US$79 million net exchange loss and other
miscellaneous expenses; netted with incentives received in recognition of the Group’s research and development
related spending of US$87 million.
The net other operating income of last year represented mainly US$38 million net exchange loss and other
miscellaneous expenses, netted with incentives received in recognition of the Group’s research and development
related spending of US$83 million.
2014 2013
For the year ended March 31 US$’000 US$’000
Depreciation of property, plant and equipment and amortization of prepaid
lease payments 109,689 92,097
Amortization of intangible assets 145,444 117,507
Employee benefit costs, including 2,745,853 2,359,593
– long-term incentive awards 80,274 77,724
Rental expenses under operating leases 99,024 77,530