Lenovo 2014 Annual Report Download - page 169
Download and view the complete annual report
Please find page 169 of the 2014 Lenovo annual report below. You can navigate through the pages in the report by either clicking on the pages listed below, or by using the keyword search tool below to find specific information within the annual report.-
 1
1 -
2
-
3
-
4
-
5
-
6
-
7
-
8
-
9
-
10
-
11
-
12
-
13
-
14
-
15
-
16
-
17
-
18
-
19
-
20
-
21
-
22
-
23
-
24
-
25
-
26
-
27
-
28
-
29
-
30
-
31
-
32
-
33
-
34
-
35
-
36
-
37
-
38
-
39
-
40
-
41
-
42
-
43
-
44
-
45
-
46
-
47
-
48
-
49
-
50
-
51
-
52
-
53
-
54
-
55
-
56
-
57
-
58
-
59
-
60
-
61
-
62
-
63
-
64
-
65
-
66
-
67
-
68
-
69
-
70
-
71
-
72
-
73
-
74
-
75
-
76
-
77
-
78
-
79
-
80
-
81
-
82
-
83
-
84
-
85
-
86
-
87
-
88
-
89
-
90
-
91
-
92
-
93
-
94
-
95
-
96
-
97
-
98
-
99
-
100
-
101
-
102
-
103
-
104
-
105
-
106
-
107
-
108
-
109
-
110
-
111
-
112
-
113
-
114
-
115
-
116
-
117
-
118
-
119
-
120
-
121
-
122
-
123
-
124
-
125
-
126
-
127
-
128
-
129
-
130
-
131
-
132
-
133
-
134
-
135
-
136
-
137
-
138
-
139
-
140
-
141
-
142
-
143
-
144
-
145
-
146
-
147
-
148
-
149
-
150
-
151
-
152
-
153
-
154
-
155
-
156
-
157
-
158
-
 159
159 -
 160
160 -
 161
161 -
 162
162 -
 163
163 -
 164
164 -
 165
165 -
 166
166 -
 167
167 -
 168
168 -
 169
169 -
 170
170 -
 171
171 -
 172
172 -
 173
173 -
 174
174 -
 175
175 -
 176
176 -
 177
177 -
 178
178 -
 179
179 -
180
-
181
-
182
-
183
-
184
-
185
-
186
-
187
-
188
-
189
-
190
-
191
-
192
-
193
-
194
-
195
-
196
-
197
-
198
-
199
 |
 |
167
2013/14 Annual Report Lenovo Group Limited
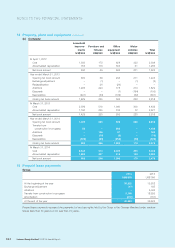
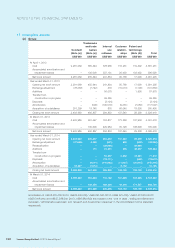
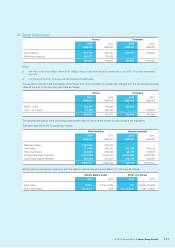
17 Intangible assets
(continued)
(b) Company
Internal
use software
US$’000
At April 1, 2012
Cost 74,919
Accumulated amortization 29,117
Net book amount 45,802
Year ended March 31, 2013
Opening net book amount 45,802
Exchange adjustment 12
Transfer from construction-in-progress 18,476
Additions 2,119
Disposals (53)
Amortization (14,223)
Closing net book amount 52,133
At March 31, 2013
Cost 95,446
Accumulated amortization 43,313
Net book amount 52,133
Year ended March 31, 2014
Opening net book amount 52,133
Transfer from construction-in-progress 5,406
Additions 224
Disposals (1,939)
Amortization (16,555)
Closing net book amount 39,269
At March 31, 2014
Cost 98,241
Accumulated amortization 58,972
Net book amount 39,269
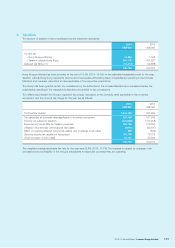
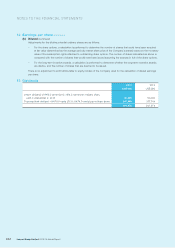
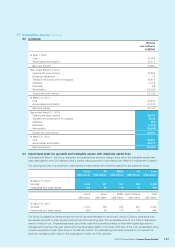
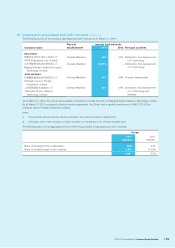
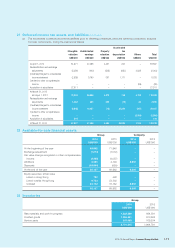
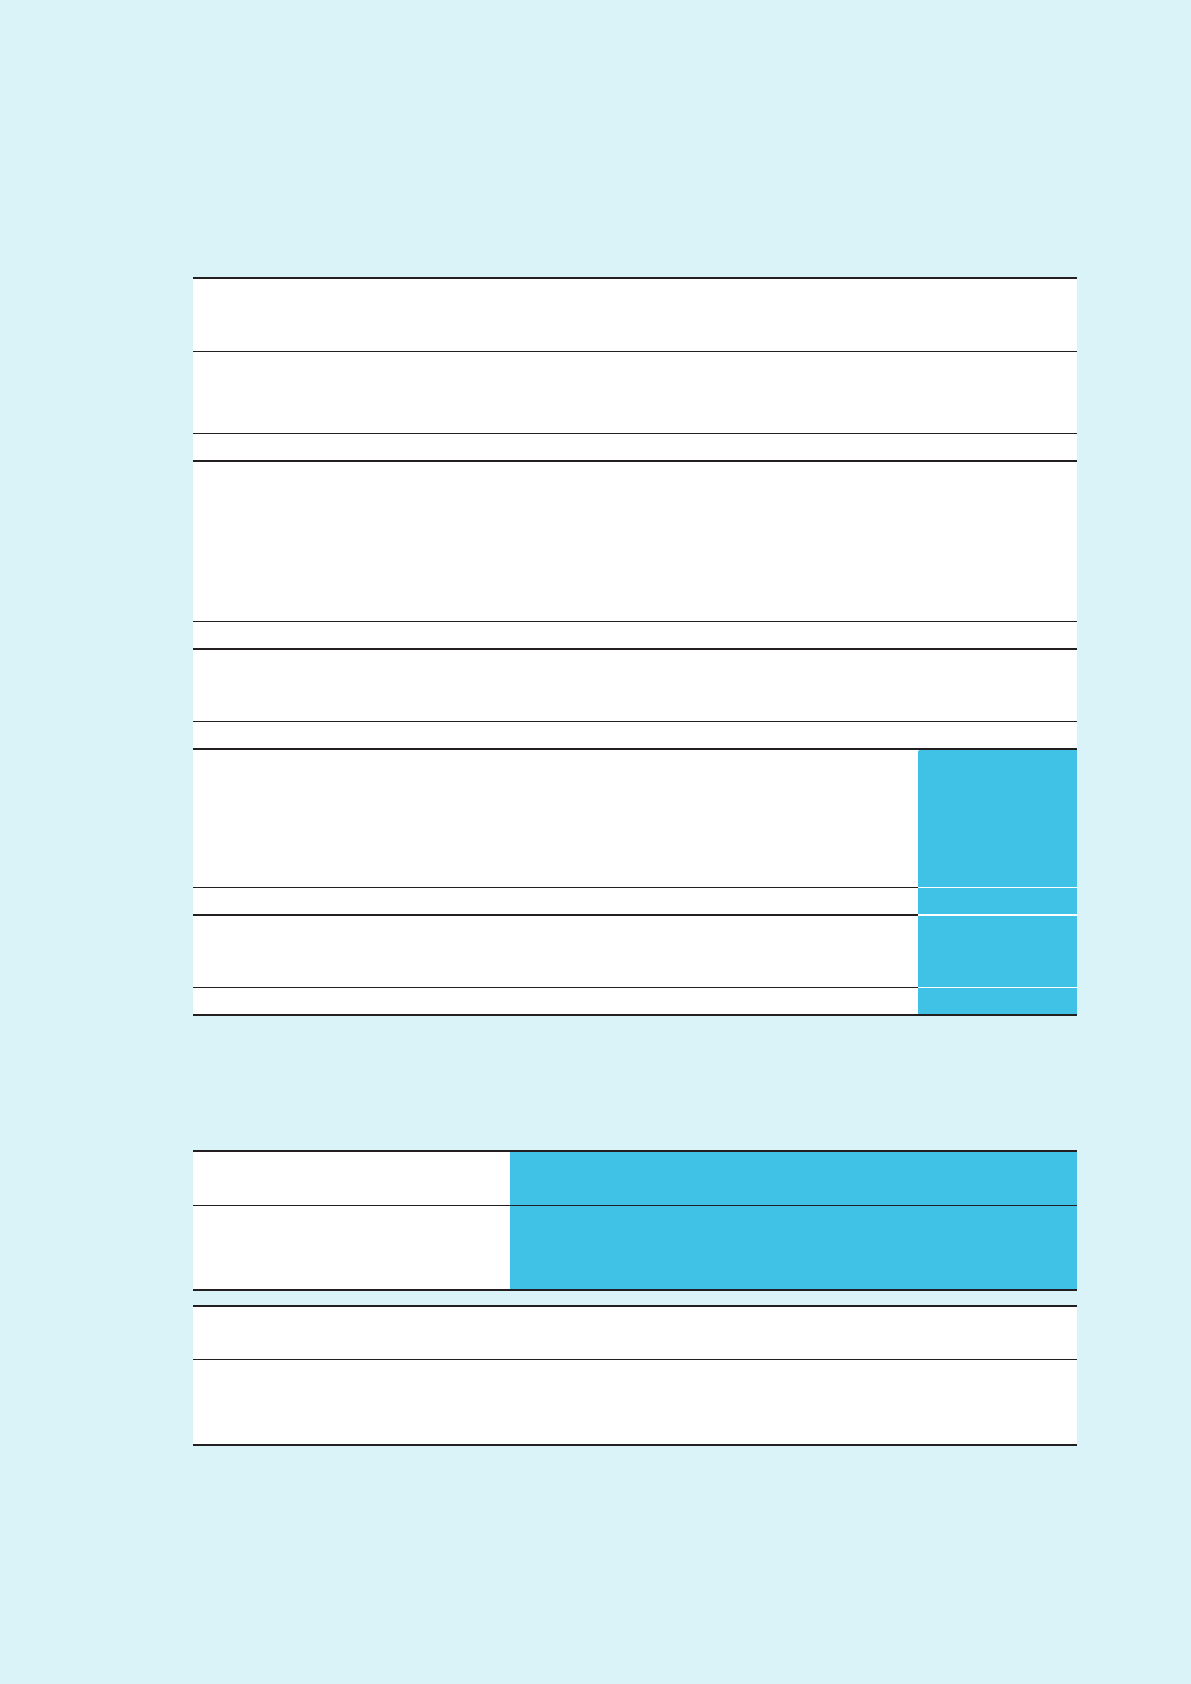
(c) Impairment tests for goodwill and intangible assets with indefinite useful lives
As explained in Note 1, the Group underwent an organizational structure change under which the intangible assets have
been reallocated to the CGU affected using a relative value approach in accordance with HKAS 36 “Impairment of assets”.
The carrying amounts of goodwill and trademarks and trade names with indefinite useful lives are presented below:
China AP EMEA AG Total
US$ million US$ million US$ million US$ million US$ million
At March 31, 2014
Goodwill 1,123 597 287 383 2,390
Trademarks and trade names 209 59 118 67 453
China APLA EMEA North America Total
US$ million US$ million US$ million US$ million US$ million
At March 31, 2013
Goodwill 1,123 789 261 231 2,404
Trademarks and trade names 209 68 113 58 448
The Group completed its annual impairment test for goodwill allocated to the Group’s various CGUs by comparing their
recoverable amounts to their carrying amounts as at the reporting date. The recoverable amount of a CGU is determined
based on value in use. These assessments use pre-tax cash flow projections based on financial budgets approved by
management covering a five-year period with a terminal value related to the future cash flow of the CGU extrapolated using
constant projection of cash flows beyond the five-year period. The estimated growth rates adopted do not exceed the
long-term average growth rates for the businesses in which the CGU operates.