Lenovo 2014 Annual Report Download - page 173
Download and view the complete annual report
Please find page 173 of the 2014 Lenovo annual report below. You can navigate through the pages in the report by either clicking on the pages listed below, or by using the keyword search tool below to find specific information within the annual report.-
 1
1 -
2
-
3
-
4
-
5
-
6
-
7
-
8
-
9
-
10
-
11
-
12
-
13
-
14
-
15
-
16
-
17
-
18
-
19
-
20
-
21
-
22
-
23
-
24
-
25
-
26
-
27
-
28
-
29
-
30
-
31
-
32
-
33
-
34
-
35
-
36
-
37
-
38
-
39
-
40
-
41
-
42
-
43
-
44
-
45
-
46
-
47
-
48
-
49
-
50
-
51
-
52
-
53
-
54
-
55
-
56
-
57
-
58
-
59
-
60
-
61
-
62
-
63
-
64
-
65
-
66
-
67
-
68
-
69
-
70
-
71
-
72
-
73
-
74
-
75
-
76
-
77
-
78
-
79
-
80
-
81
-
82
-
83
-
84
-
85
-
86
-
87
-
88
-
89
-
90
-
91
-
92
-
93
-
94
-
95
-
96
-
97
-
98
-
99
-
100
-
101
-
102
-
103
-
104
-
105
-
106
-
107
-
108
-
109
-
110
-
111
-
112
-
113
-
114
-
115
-
116
-
117
-
118
-
119
-
120
-
121
-
122
-
123
-
124
-
125
-
126
-
127
-
128
-
129
-
130
-
131
-
132
-
133
-
134
-
135
-
136
-
137
-
138
-
139
-
140
-
141
-
142
-
143
-
144
-
145
-
146
-
147
-
148
-
149
-
150
-
151
-
152
-
153
-
154
-
155
-
156
-
157
-
158
-
159
-
160
-
161
-
162
-
 163
163 -
 164
164 -
 165
165 -
 166
166 -
 167
167 -
 168
168 -
 169
169 -
 170
170 -
 171
171 -
 172
172 -
 173
173 -
 174
174 -
 175
175 -
 176
176 -
 177
177 -
 178
178 -
 179
179 -
 180
180 -
 181
181 -
 182
182 -
 183
183 -
184
-
185
-
186
-
187
-
188
-
189
-
190
-
191
-
192
-
193
-
194
-
195
-
196
-
197
-
198
-
199
 |
 |
171
2013/14 Annual Report Lenovo Group Limited
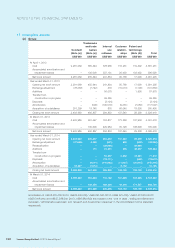
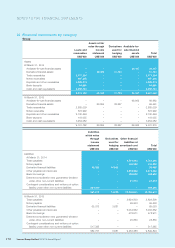
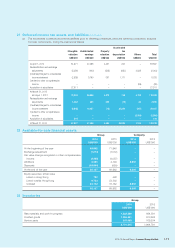
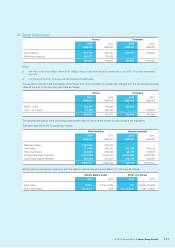
20 Financial instruments by category
(continued)
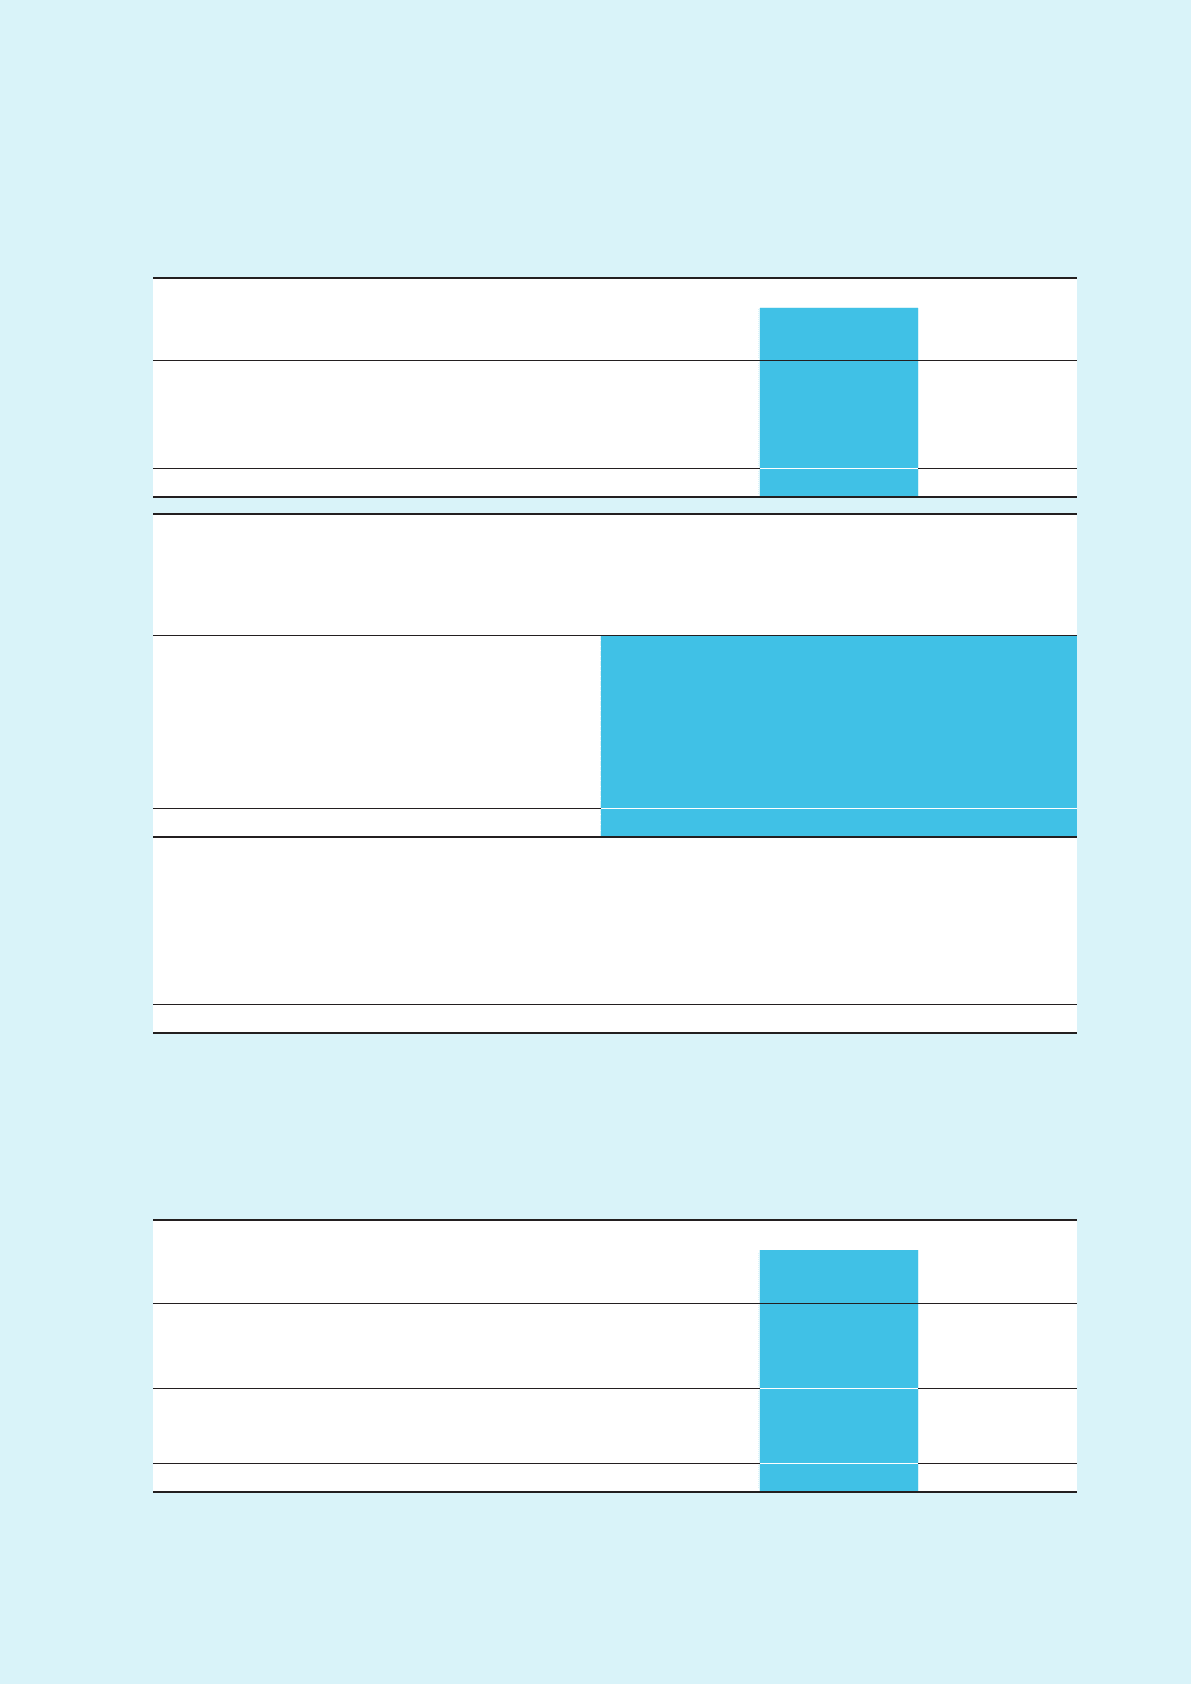
Company
Loans and receivables
2014 2013
US$’000 US$’000
Assets
Deposits 462 448
Amounts due from subsidiaries 227,859 412,660
Cash and cash equivalents 5,414 6,511
233,735 419,619
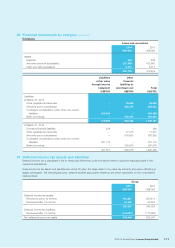
Liabilities
at fair value
through income
statement
Other
financial
liabilities at
amortized cost Total
US$’000 US$’000 US$’000
Liabilities
At March 31, 2014
Other payables and accruals –36,685 36,685
Amounts due to subsidiaries –525,553 525,553
Contingent consideration under other non-current
liabilities 305,929 –305,929
Bank borrowings –300,000 300,000
305,929 862,238 1,168,167
At March 31, 2013
Derivative financial liabilities 238 –238
Other payables and accruals –17,415 17,415
Amounts due to subsidiaries –676,663 676,663
Contingent consideration under other non-current
liabilities 301,113 –301,113
Bank borrowings –300,000 300,000
301,351 994,078 1,295,429
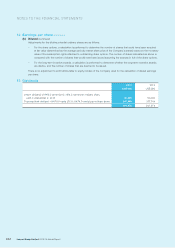
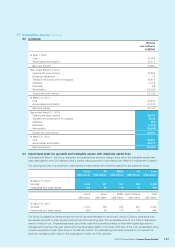
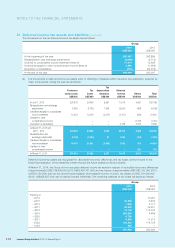
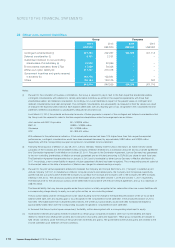
21 Deferred income tax assets and liabilities
Deferred income tax is calculated in full on temporary differences under the liability method using the rates applicable in the
respective jurisdictions.
Deferred income tax assets and liabilities are netted off when the taxes relate to the same tax authority and where offsetting is
legally enforceable. The following amounts, determined after appropriate offsetting, are shown separately on the consolidated
balance sheet:
Group
2014 2013
US$’000 US$’000
Deferred income tax assets:
Recovered within 12 months 324,837 290,414
Recovered after 12 months 64,493 58,975
389,330 349,389
Deferred income tax liabilities:
Recovered after 12 months (142,881) (113,992)
Net deferred income tax assets 246,449 235,397