Lenovo 2014 Annual Report Download - page 6
Download and view the complete annual report
Please find page 6 of the 2014 Lenovo annual report below. You can navigate through the pages in the report by either clicking on the pages listed below, or by using the keyword search tool below to find specific information within the annual report.-
 1
1 -
 2
2 -
 3
3 -
 4
4 -
 5
5 -
 6
6 -
 7
7 -
 8
8 -
 9
9 -
 10
10 -
 11
11 -
 12
12 -
 13
13 -
 14
14 -
 15
15 -
 16
16 -
 17
17 -
18
-
19
-
20
-
21
-
22
-
23
-
24
-
25
-
26
-
27
-
28
-
29
-
30
-
31
-
32
-
33
-
34
-
35
-
36
-
37
-
38
-
39
-
40
-
41
-
42
-
43
-
44
-
45
-
46
-
47
-
48
-
49
-
50
-
51
-
52
-
53
-
54
-
55
-
56
-
57
-
58
-
59
-
60
-
61
-
62
-
63
-
64
-
65
-
66
-
67
-
68
-
69
-
70
-
71
-
72
-
73
-
74
-
75
-
76
-
77
-
78
-
79
-
80
-
81
-
82
-
83
-
84
-
85
-
86
-
87
-
88
-
89
-
90
-
91
-
92
-
93
-
94
-
95
-
96
-
97
-
98
-
99
-
100
-
101
-
102
-
103
-
104
-
105
-
106
-
107
-
108
-
109
-
110
-
111
-
112
-
113
-
114
-
115
-
116
-
117
-
118
-
119
-
120
-
121
-
122
-
123
-
124
-
125
-
126
-
127
-
128
-
129
-
130
-
131
-
132
-
133
-
134
-
135
-
136
-
137
-
138
-
139
-
140
-
141
-
142
-
143
-
144
-
145
-
146
-
147
-
148
-
149
-
150
-
151
-
152
-
153
-
154
-
155
-
156
-
157
-
158
-
159
-
160
-
161
-
162
-
163
-
164
-
165
-
166
-
167
-
168
-
169
-
170
-
171
-
172
-
173
-
174
-
175
-
176
-
177
-
178
-
179
-
180
-
181
-
182
-
183
-
184
-
185
-
186
-
187
-
188
-
189
-
190
-
191
-
192
-
193
-
194
-
195
-
196
-
197
-
198
-
199
 |
 |
4Lenovo Group Limited 2013/14 Annual Report
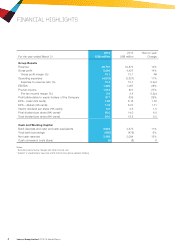
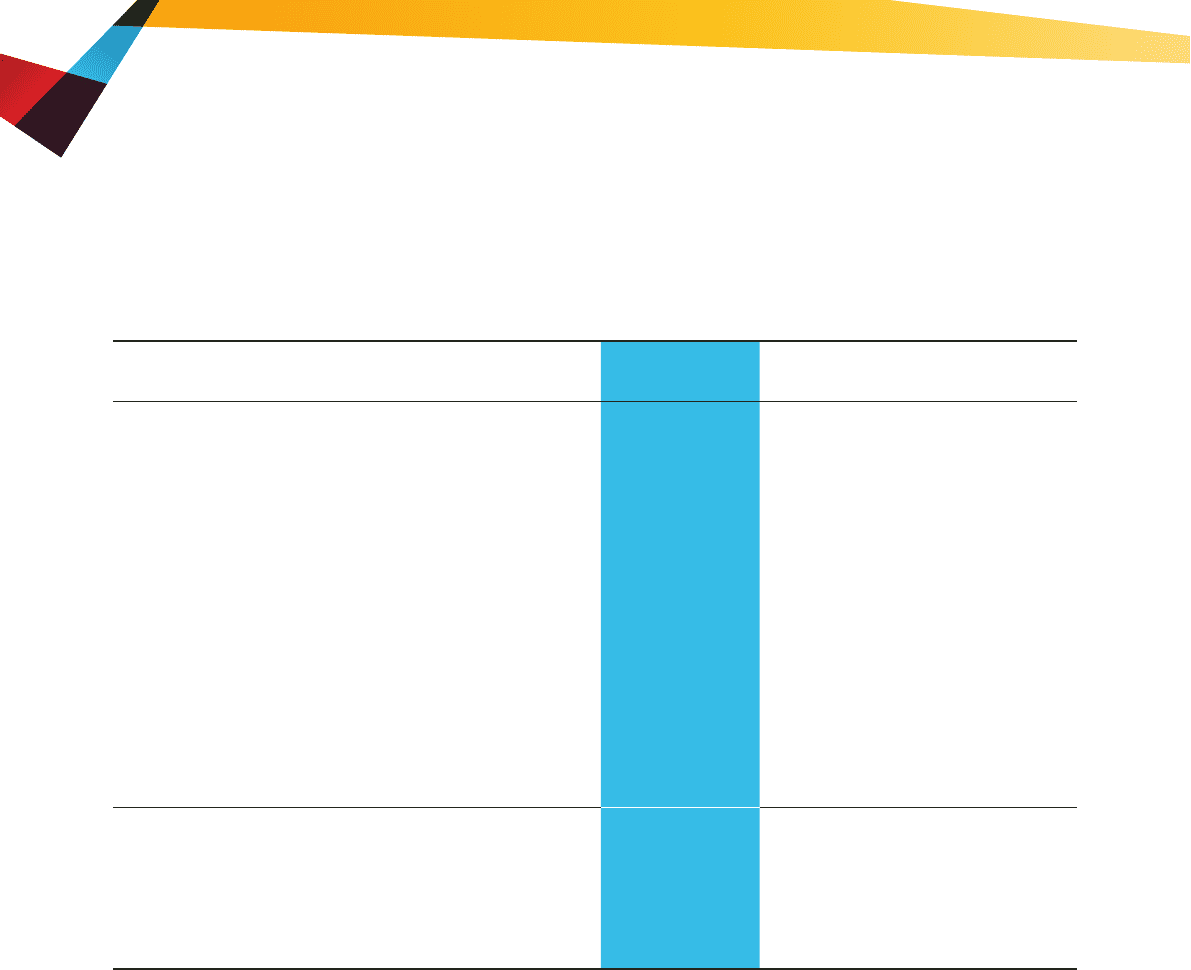
FINANCIAL HIGHLIGHTS
For the year ended March 31
2014
US$ million
2013
US$ million
Year-on-year
Change
Group Results
Revenue 38,707 33,873 14%
Gross profit 5,064 4,427 14%
Gross profit margin (%) 13.1 13.1 Nil
Operating expenses (4,012) (3,627) 11%
Expense-to-revenue ratio (%) 10.4 10.7 -0.3pt
EBITDA11,365 1,067 28%
Pre-tax income 1,014 801 27%
Pre-tax income margin (%) 2.6 2.4 0.2pt
Profit attributable to equity holders of the Company 817 635 29%
EPS – basic (US cents) 7.88 6.16 1.72
EPS – diluted (US cents) 7.78 6.07 1.71
Interim dividend per share (HK cents) 6.0 4.5 1.5
Final dividend per share (HK cents)218.0 14.0 4.0
Total dividend per share (HK cents) 24.0 18.5 5.5
Cash and Working Capital
Bank deposits and cash and cash equivalents 3,953 3,573 11%
Total bank borrowings (455) (479) -5%
Net cash reserves 3,498 3,094 13%
Cash conversion cycle (days) (2) (8) 6
Notes:
1 Excluding restructuring charges and other income, net.
2 Subject to shareholders’ approval at the forthcoming annual general meeting.