Lenovo 2014 Annual Report Download - page 189
Download and view the complete annual report
Please find page 189 of the 2014 Lenovo annual report below. You can navigate through the pages in the report by either clicking on the pages listed below, or by using the keyword search tool below to find specific information within the annual report.-
 1
1 -
2
-
3
-
4
-
5
-
6
-
7
-
8
-
9
-
10
-
11
-
12
-
13
-
14
-
15
-
16
-
17
-
18
-
19
-
20
-
21
-
22
-
23
-
24
-
25
-
26
-
27
-
28
-
29
-
30
-
31
-
32
-
33
-
34
-
35
-
36
-
37
-
38
-
39
-
40
-
41
-
42
-
43
-
44
-
45
-
46
-
47
-
48
-
49
-
50
-
51
-
52
-
53
-
54
-
55
-
56
-
57
-
58
-
59
-
60
-
61
-
62
-
63
-
64
-
65
-
66
-
67
-
68
-
69
-
70
-
71
-
72
-
73
-
74
-
75
-
76
-
77
-
78
-
79
-
80
-
81
-
82
-
83
-
84
-
85
-
86
-
87
-
88
-
89
-
90
-
91
-
92
-
93
-
94
-
95
-
96
-
97
-
98
-
99
-
100
-
101
-
102
-
103
-
104
-
105
-
106
-
107
-
108
-
109
-
110
-
111
-
112
-
113
-
114
-
115
-
116
-
117
-
118
-
119
-
120
-
121
-
122
-
123
-
124
-
125
-
126
-
127
-
128
-
129
-
130
-
131
-
132
-
133
-
134
-
135
-
136
-
137
-
138
-
139
-
140
-
141
-
142
-
143
-
144
-
145
-
146
-
147
-
148
-
149
-
150
-
151
-
152
-
153
-
154
-
155
-
156
-
157
-
158
-
159
-
160
-
161
-
162
-
163
-
164
-
165
-
166
-
167
-
168
-
169
-
170
-
171
-
172
-
173
-
174
-
175
-
176
-
177
-
178
-
 179
179 -
 180
180 -
 181
181 -
 182
182 -
 183
183 -
 184
184 -
 185
185 -
 186
186 -
 187
187 -
 188
188 -
 189
189 -
 190
190 -
 191
191 -
 192
192 -
 193
193 -
 194
194 -
 195
195 -
 196
196 -
 197
197 -
 198
198 -
 199
199
 |
 |

187
2013/14 Annual Report Lenovo Group Limited
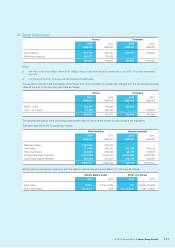
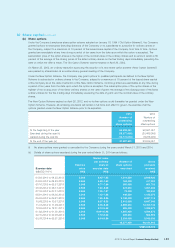
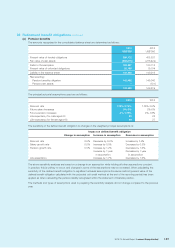
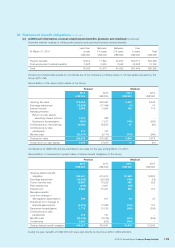
36 Retirement benefit obligations
(continued)
(a) Pension benefits
The amounts recognized in the consolidated balance sheet are determined as follows:
2014 2013
US$’000 US$’000
Present value of funded obligations 389,172 405,537
Fair value of plan assets (266,875) (275,422)
Deficit of funded plans 122,297 130,115
Present value of unfunded obligations 20,185 19,104
Liability in the balance sheet 142,482 149,219
Representing:
Pension benefits obligation 142,482 149,340
Pension plan assets –(121)
142,482 149,219
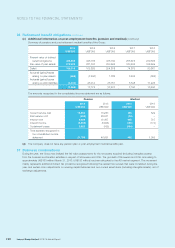
The principal actuarial assumptions used are as follows:
2014 2013
Discount rate 1.75%-3.75% 1.75%-3.5%
Future salary increases 0%-3% 2%-5%
Future pension increases 0%-1.75% 0%-1.8%
Life expectancy for male aged 60 23 23
Life expectancy for female aged 60 29 27
The sensitivity of the defined benefit obligation to changes in the weighted principal assumptions is:
Impact on defined benefit obligation
Change in assumption Increase in assumption Decrease in assumption
Discount rate 0.5% Decrease by 6.6% Increase by 7.4%
Salary growth rate 0.5% Increase by 0.5% Decrease by 0.5%
Pension growth rate 0.5% Increase by 1.2% Decrease by 1.6%
Increase by 1 year
in assumption
Decrease by 1 year
in assumption
Life expectancy Increase by 1.7% Decrease by 1.6%
The above sensitivity analyses are based on a change in an assumption while holding all other assumptions constant.
In practice, this is unlikely to occur, and changes in some of the assumptions may be correlated. When calculating the
sensitivity of the defined benefit obligation to significant actuarial assumptions the same method (present value of the
defined benefit obligation calculated with the projected unit credit method at the end of the reporting period) has been
applied as when calculating the pension liability recognised within the statement of financial position.
The methods and types of assumptions used in preparing the sensitivity analysis did not change compared to the previous
year.