Lenovo 2014 Annual Report Download - page 83
Download and view the complete annual report
Please find page 83 of the 2014 Lenovo annual report below. You can navigate through the pages in the report by either clicking on the pages listed below, or by using the keyword search tool below to find specific information within the annual report.-
 1
1 -
2
-
3
-
4
-
5
-
6
-
7
-
8
-
9
-
10
-
11
-
12
-
13
-
14
-
15
-
16
-
17
-
18
-
19
-
20
-
21
-
22
-
23
-
24
-
25
-
26
-
27
-
28
-
29
-
30
-
31
-
32
-
33
-
34
-
35
-
36
-
37
-
38
-
39
-
40
-
41
-
42
-
43
-
44
-
45
-
46
-
47
-
48
-
49
-
50
-
51
-
52
-
53
-
54
-
55
-
56
-
57
-
58
-
59
-
60
-
61
-
62
-
63
-
64
-
65
-
66
-
67
-
68
-
69
-
70
-
71
-
72
-
 73
73 -
 74
74 -
 75
75 -
 76
76 -
 77
77 -
 78
78 -
 79
79 -
 80
80 -
 81
81 -
 82
82 -
 83
83 -
 84
84 -
 85
85 -
 86
86 -
 87
87 -
 88
88 -
 89
89 -
 90
90 -
 91
91 -
 92
92 -
 93
93 -
94
-
95
-
96
-
97
-
98
-
99
-
100
-
101
-
102
-
103
-
104
-
105
-
106
-
107
-
108
-
109
-
110
-
111
-
112
-
113
-
114
-
115
-
116
-
117
-
118
-
119
-
120
-
121
-
122
-
123
-
124
-
125
-
126
-
127
-
128
-
129
-
130
-
131
-
132
-
133
-
134
-
135
-
136
-
137
-
138
-
139
-
140
-
141
-
142
-
143
-
144
-
145
-
146
-
147
-
148
-
149
-
150
-
151
-
152
-
153
-
154
-
155
-
156
-
157
-
158
-
159
-
160
-
161
-
162
-
163
-
164
-
165
-
166
-
167
-
168
-
169
-
170
-
171
-
172
-
173
-
174
-
175
-
176
-
177
-
178
-
179
-
180
-
181
-
182
-
183
-
184
-
185
-
186
-
187
-
188
-
189
-
190
-
191
-
192
-
193
-
194
-
195
-
196
-
197
-
198
-
199
 |
 |
81
2013/14 Annual Report Lenovo Group Limited
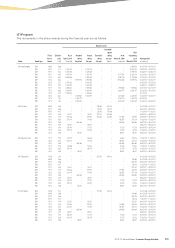
Remuneration of Senior Management
The remuneration of senior management fell within the following bands for the year ended March 31, 2014:
Remuneration bands Number of senior management
US$3,931,450 to US$3,995,899 1
US$4,447,050 to US$4,511,499 1
US$5,156,000 to US$5,220,449 1
US$5,478,250 to US$5,542,699 1
US$5,607,150 to US$5,671,599 1
US$6,316,100 to US$6,380,549 1
US$10,376,450 to US$10,440,899 1
Fiscal Year 2013-14 Employees Review
Fixed Compensation
Each year management conducts a market review to ensure fixed compensation changes are aligned and competitive
with market trends. The review incorporates input from several external survey providers and formal assessments of
individual performance. Any approved market-based merit increases were effective from July 1, 2013.
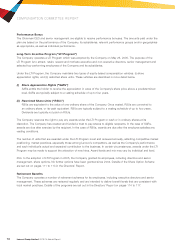
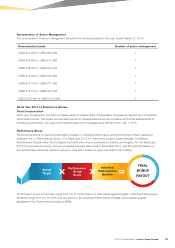
Performance Bonus
Performance bonus for general employees is based on individual performance and performance of their respective
business unit or “Performance Group”. For fiscal year 2013/14, there were a total of approximately 30 different
Performance Groups within the Company each with their unique performance metrics and targets. For the fiscal year
2013/14 performance bonus, mid-year progress payment was made in December 2013, and full payment based on
annual business outcomes will be trued-up in June 2014 based on approved final bonus funding.
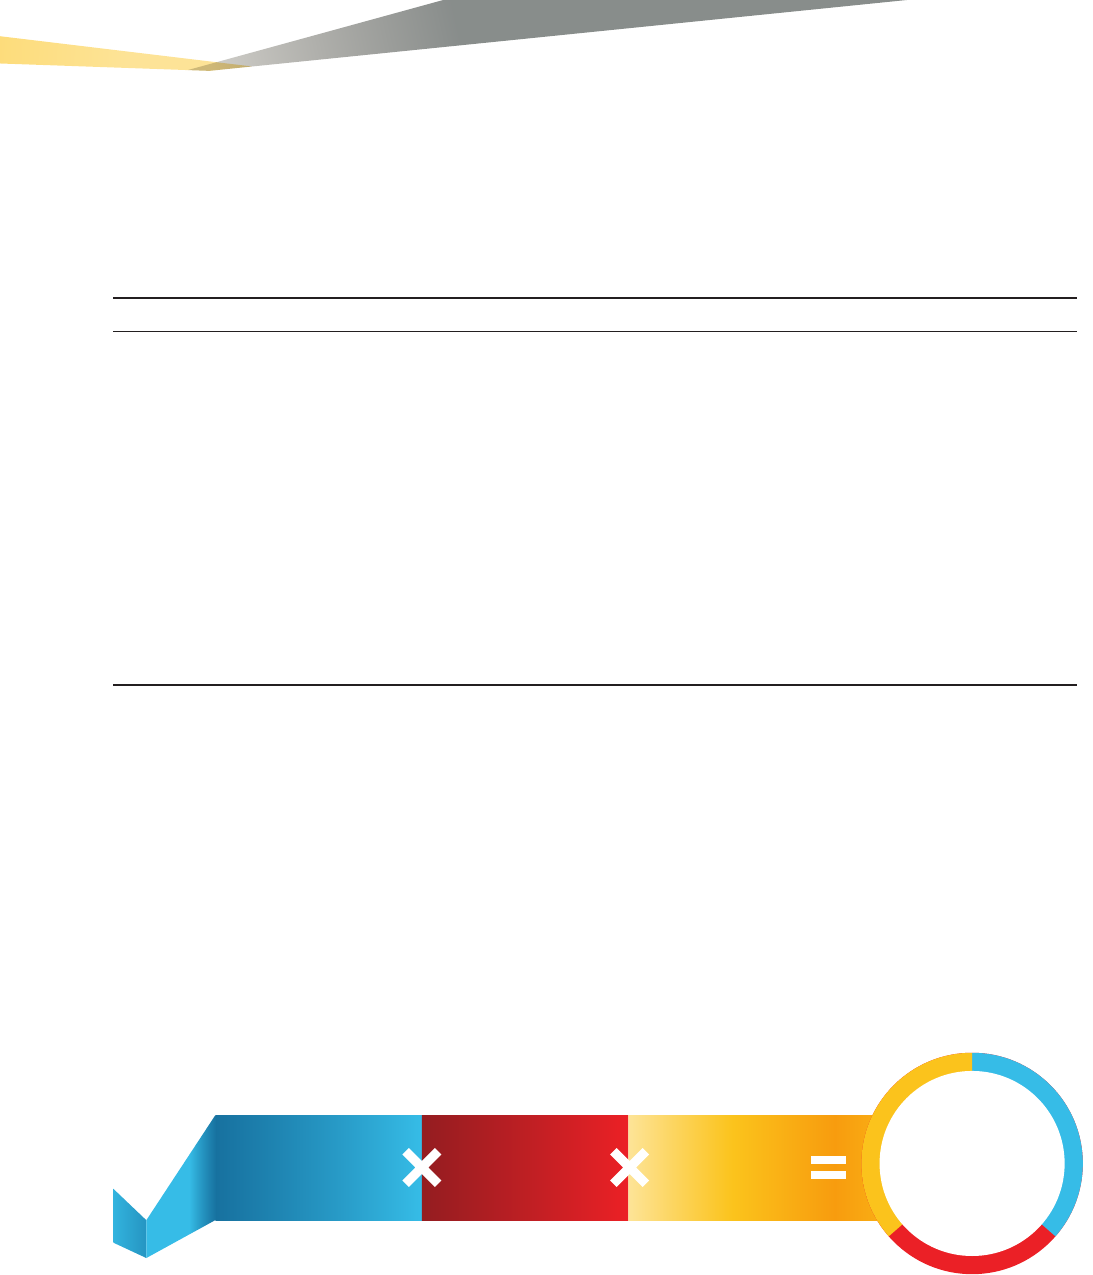
Bonus
Target
Performance
Group
Score
Individual
Performance
Modifier
FINAL
BONUS
PAYOUT
Performance Group scores may range from 0% to 300% based on final results against targets. Individual Performance
Modifiers range from 0% to 150% and are linked to the employee Performance Ratings and progress against
established Key Performance Indicators (KPIs).