Lenovo 2014 Annual Report Download - page 127
Download and view the complete annual report
Please find page 127 of the 2014 Lenovo annual report below. You can navigate through the pages in the report by either clicking on the pages listed below, or by using the keyword search tool below to find specific information within the annual report.-
 1
1 -
2
-
3
-
4
-
5
-
6
-
7
-
8
-
9
-
10
-
11
-
12
-
13
-
14
-
15
-
16
-
17
-
18
-
19
-
20
-
21
-
22
-
23
-
24
-
25
-
26
-
27
-
28
-
29
-
30
-
31
-
32
-
33
-
34
-
35
-
36
-
37
-
38
-
39
-
40
-
41
-
42
-
43
-
44
-
45
-
46
-
47
-
48
-
49
-
50
-
51
-
52
-
53
-
54
-
55
-
56
-
57
-
58
-
59
-
60
-
61
-
62
-
63
-
64
-
65
-
66
-
67
-
68
-
69
-
70
-
71
-
72
-
73
-
74
-
75
-
76
-
77
-
78
-
79
-
80
-
81
-
82
-
83
-
84
-
85
-
86
-
87
-
88
-
89
-
90
-
91
-
92
-
93
-
94
-
95
-
96
-
97
-
98
-
99
-
100
-
101
-
102
-
103
-
104
-
105
-
106
-
107
-
108
-
109
-
110
-
111
-
112
-
113
-
114
-
115
-
116
-
 117
117 -
 118
118 -
 119
119 -
 120
120 -
 121
121 -
 122
122 -
 123
123 -
 124
124 -
 125
125 -
 126
126 -
 127
127 -
 128
128 -
 129
129 -
 130
130 -
 131
131 -
 132
132 -
 133
133 -
 134
134 -
 135
135 -
 136
136 -
 137
137 -
138
-
139
-
140
-
141
-
142
-
143
-
144
-
145
-
146
-
147
-
148
-
149
-
150
-
151
-
152
-
153
-
154
-
155
-
156
-
157
-
158
-
159
-
160
-
161
-
162
-
163
-
164
-
165
-
166
-
167
-
168
-
169
-
170
-
171
-
172
-
173
-
174
-
175
-
176
-
177
-
178
-
179
-
180
-
181
-
182
-
183
-
184
-
185
-
186
-
187
-
188
-
189
-
190
-
191
-
192
-
193
-
194
-
195
-
196
-
197
-
198
-
199
 |
 |

125
2013/14 Annual Report Lenovo Group Limited
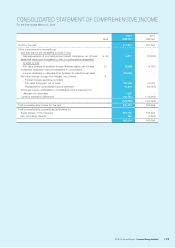
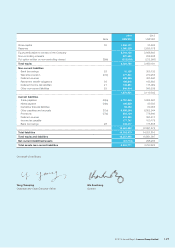
CONSOLIDATED STATEMENT OF COMPREHENSIVE INCOME
For the year ended March 31, 2014
2014 2013
Note US$’000 US$’000
Profit for the year 817,470 631,592
Other comprehensive income/(loss):
Item that will not be reclassified to profit or loss
Remeasurements of post-employment benefit obligations, net of taxes 9, 36 4,177 (18,806)
Items that have been reclassified or may be subsequently reclassified
to profit or loss
Fair value change on available-for-sale financial assets, net of taxes 22 (2,288) (4,057)
Investment revaluation reserve reclassified to consolidated
income statement on disposal of an available-for-sale financial asset (20,526) –
Fair value change on cash flow hedges, net of taxes 9
– Forward foreign exchange contracts
Fair value (loss)/gain, net of taxes (49,106) 40,725
Reclassified to consolidated income statement 10,818 (20,953)
Exchange reserve reclassified to consolidated income statement on
disposal of a subsidiary 1,250 –
Currency translation differences (69,781) (118,602)
(125,456) (121,693)
Total comprehensive income for the year 692,014 509,899
Total comprehensive income/(loss) attributable to:
Equity holders of the Company 691,772 513,455
Non-controlling interests 242 (3,556)
692,014 509,899