Lenovo 2014 Annual Report Download - page 31
Download and view the complete annual report
Please find page 31 of the 2014 Lenovo annual report below. You can navigate through the pages in the report by either clicking on the pages listed below, or by using the keyword search tool below to find specific information within the annual report.-
 1
1 -
2
-
3
-
4
-
5
-
6
-
7
-
8
-
9
-
10
-
11
-
12
-
13
-
14
-
15
-
16
-
17
-
18
-
19
-
20
-
 21
21 -
 22
22 -
 23
23 -
 24
24 -
 25
25 -
 26
26 -
 27
27 -
 28
28 -
 29
29 -
 30
30 -
 31
31 -
 32
32 -
 33
33 -
 34
34 -
 35
35 -
 36
36 -
 37
37 -
 38
38 -
 39
39 -
 40
40 -
 41
41 -
42
-
43
-
44
-
45
-
46
-
47
-
48
-
49
-
50
-
51
-
52
-
53
-
54
-
55
-
56
-
57
-
58
-
59
-
60
-
61
-
62
-
63
-
64
-
65
-
66
-
67
-
68
-
69
-
70
-
71
-
72
-
73
-
74
-
75
-
76
-
77
-
78
-
79
-
80
-
81
-
82
-
83
-
84
-
85
-
86
-
87
-
88
-
89
-
90
-
91
-
92
-
93
-
94
-
95
-
96
-
97
-
98
-
99
-
100
-
101
-
102
-
103
-
104
-
105
-
106
-
107
-
108
-
109
-
110
-
111
-
112
-
113
-
114
-
115
-
116
-
117
-
118
-
119
-
120
-
121
-
122
-
123
-
124
-
125
-
126
-
127
-
128
-
129
-
130
-
131
-
132
-
133
-
134
-
135
-
136
-
137
-
138
-
139
-
140
-
141
-
142
-
143
-
144
-
145
-
146
-
147
-
148
-
149
-
150
-
151
-
152
-
153
-
154
-
155
-
156
-
157
-
158
-
159
-
160
-
161
-
162
-
163
-
164
-
165
-
166
-
167
-
168
-
169
-
170
-
171
-
172
-
173
-
174
-
175
-
176
-
177
-
178
-
179
-
180
-
181
-
182
-
183
-
184
-
185
-
186
-
187
-
188
-
189
-
190
-
191
-
192
-
193
-
194
-
195
-
196
-
197
-
198
-
199
 |
 |

29
2013/14 Annual Report Lenovo Group Limited
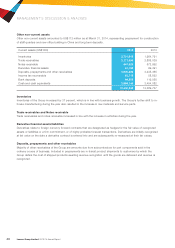
LIQUIDITY AND FINANCIAL RESOURCES
At March 31, 2014, total assets of the Group amounted to US$18,357 million (2013: US$16,882 million), which
were financed by equity attributable to owners of the Company of US$3,010 million (2013: US$2,667 million), non-
controlling interests (net of put option written on non-controlling interest) of US$15 million (2013: US$13 million), and
total liabilities of US$15,332 million (2013: US$14,202 million). At March 31, 2014, the current ratio of the Group was
1.00 (2013: 1.02).
The Group had a solid financial position. At March 31, 2014, bank deposits, cash and cash equivalents totaled
US$3,953 million (2013: US$3,573 million), of which 66.9 (2013: 56.5) percent was denominated in US dollar, 23.8
(2013: 32.4) percent in Renminbi, 4.1 (2013: 3.4) percent in Euros, 2.2 (2013: 3.4) percent in Japanese Yen, and 3.0
(2013: 4.3) percent in other currencies.
The Group adopts a conservative policy to invest the surplus cash generated from operations. At March 31, 2014,
81.8 (2013: 76.3) percent of cash are bank deposits, and 18.2 (2013: 23.7) percent of cash are investments in liquid
money market funds of investment grade.
Although the Group has consistently maintained a very liquid position, banking facilities have nevertheless been put in
place for contingency purposes.
The Group entered into a 5-Year loan facility agreement of US$300 million with a bank on July 17, 2009. At March 31,
2014 and 2013, the facility was fully utilized, and the loan is repayable in July 2014.
The Group entered into a 5-Year loan facility agreement with syndicated banks for US$500 million on February 2, 2011.
The facility has not been utilized as at March 31, 2014 (2013: Nil).
In addition, on December 18, 2013, the Group entered into a 5-Year loan facility agreement with syndicated banks for
US$1,200 million. The facility has not been utilized as at March 31, 2014.
On May 8, 2014, the Group completed the issuance of a 5-Year US$1,500 million, bearing annual interest at 4.7%,
Notes due 2019. The proceeds of the Notes would be used for general corporate purposes including working capital,
and to fund any acquisition activities.
The Group has also arranged other short-term credit facilities. At March 31, 2014, the Group’s total available credit
facilities amounted to US$7,890 million (2013: US$6,993 million), of which US$489 million (2013: US$391 million) was
in trade lines, US$325 million (2013: US$668 million) in short-term and revolving money market facilities and US$7,076
million (2013: US$5,934 million) in forward foreign exchange contracts. At March 31, 2014, the amounts drawn down
were US$214 million (2013: US$242 million) in trade lines, US$6,513 million (2013: US$4,945 million) being used for
the forward foreign exchange contracts; and US$145 million (2013: US$176 million) in short-term bank loans.
At March 31, 2014, the Group’s outstanding bank loans represented the term loan of US$310 million, including
US$300 million reclassified as current as it will be due for repayment in July 2014 (2013: US$303 million) and short-
term bank loans of US$145 million (2013: US$176 million). When compared with total equity of US3,025 million (2013:
US$2,680 million), the Group’s gearing ratio was 0.15 (2013: 0.18). The net cash position of the Group at March 31,
2014 is US$3,498 million (2013: US$3,094 million).