Lenovo 2014 Annual Report Download - page 172
Download and view the complete annual report
Please find page 172 of the 2014 Lenovo annual report below. You can navigate through the pages in the report by either clicking on the pages listed below, or by using the keyword search tool below to find specific information within the annual report.-
 1
1 -
2
-
3
-
4
-
5
-
6
-
7
-
8
-
9
-
10
-
11
-
12
-
13
-
14
-
15
-
16
-
17
-
18
-
19
-
20
-
21
-
22
-
23
-
24
-
25
-
26
-
27
-
28
-
29
-
30
-
31
-
32
-
33
-
34
-
35
-
36
-
37
-
38
-
39
-
40
-
41
-
42
-
43
-
44
-
45
-
46
-
47
-
48
-
49
-
50
-
51
-
52
-
53
-
54
-
55
-
56
-
57
-
58
-
59
-
60
-
61
-
62
-
63
-
64
-
65
-
66
-
67
-
68
-
69
-
70
-
71
-
72
-
73
-
74
-
75
-
76
-
77
-
78
-
79
-
80
-
81
-
82
-
83
-
84
-
85
-
86
-
87
-
88
-
89
-
90
-
91
-
92
-
93
-
94
-
95
-
96
-
97
-
98
-
99
-
100
-
101
-
102
-
103
-
104
-
105
-
106
-
107
-
108
-
109
-
110
-
111
-
112
-
113
-
114
-
115
-
116
-
117
-
118
-
119
-
120
-
121
-
122
-
123
-
124
-
125
-
126
-
127
-
128
-
129
-
130
-
131
-
132
-
133
-
134
-
135
-
136
-
137
-
138
-
139
-
140
-
141
-
142
-
143
-
144
-
145
-
146
-
147
-
148
-
149
-
150
-
151
-
152
-
153
-
154
-
155
-
156
-
157
-
158
-
159
-
160
-
161
-
 162
162 -
 163
163 -
 164
164 -
 165
165 -
 166
166 -
 167
167 -
 168
168 -
 169
169 -
 170
170 -
 171
171 -
 172
172 -
 173
173 -
 174
174 -
 175
175 -
 176
176 -
 177
177 -
 178
178 -
 179
179 -
 180
180 -
 181
181 -
 182
182 -
183
-
184
-
185
-
186
-
187
-
188
-
189
-
190
-
191
-
192
-
193
-
194
-
195
-
196
-
197
-
198
-
199
 |
 |

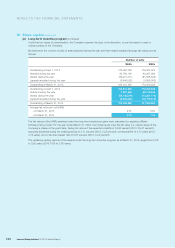
170 Lenovo Group Limited 2013/14 Annual Report
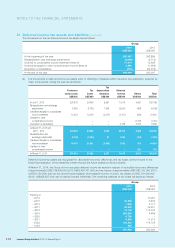
NOTES TO THE FINANCIAL STATEMENTS
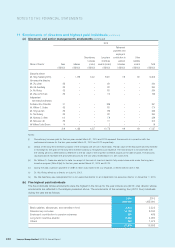
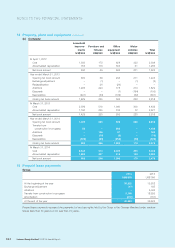
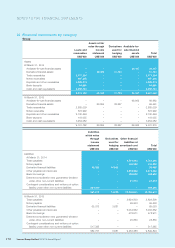
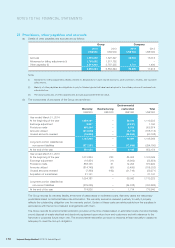
20 Financial instruments by category
Group
Loans and
receivables
Assets at fair
value through
income
statement
Derivatives
used for
hedging
Available-for-
sale financial
assets Total
US$’000 US$’000 US$’000 US$’000 US$’000
Assets
At March 31, 2014
Available-for-sale financial assets –––35,157 35,157
Derivative financial assets –49,460 11,724 –61,184
Trade receivables 3,171,354 – – – 3,171,354
Notes receivables 447,325 –––447,325
Deposits and other receivables 1,939,314 –––1,939,314
Bank deposits 94,985 – – – 94,985
Cash and cash equivalents 3,858,144 – – – 3,858,144
9,511,122 49,460 11,724 35,157 9,607,463
At March 31, 2013
Available-for-sale financial assets – – – 69,962 69,962
Derivative financial assets –60,864 38,627 –99,491
Trade receivables 2,885,039 –––2,885,039
Notes receivable 572,992 – – – 572,992
Deposits and other receivables 2,130,594 – – – 2,130,594
Bank deposits 119,055 –––119,055
Cash and cash equivalents 3,454,082 –––3,454,082
9,161,762 60,864 38,627 69,962 9,331,215
Liabilities
at fair value
through
income
statement
Derivatives
used for
hedging
Other financial
liabilities at
amortized cost Total
US$’000 US$’000 US$’000 US$’000
Liabilities
At March 31, 2014
Trade payables – – 4,751,345 4,751,345
Notes payable – – 108,559 108,559
Derivative financial liabilities 43,530 14,932 –58,462
Other payables and accruals – – 4,873,232 4,873,232
Bank borrowings – – 455,602 455,602
Deferred consideration and guaranteed dividend
under other non-current liabilities – – 21,073 21,073
Contingent considerations and written put option
liability under other non-current liabilities 524,340 – – 524,340
567,870 14,932 10,209,811 10,792,613
At March 31, 2013
Trade payables – – 3,624,500 3,624,500
Notes payable – – 99,503 99,503
Derivative financial liabilities 65,372 3,681 –69,053
Other payables and accruals – – 5,034,562 5,034,562
Bank borrowings – – 478,971 478,971
Deferred consideration and guaranteed dividend
under other non-current liabilities – – 25,850 25,850
Contingent considerations and written put option
liability under other non-current liabilities 517,385 – – 517,385
582,757 3,681 9,263,386 9,849,824