Lenovo 2014 Annual Report Download - page 182
Download and view the complete annual report
Please find page 182 of the 2014 Lenovo annual report below. You can navigate through the pages in the report by either clicking on the pages listed below, or by using the keyword search tool below to find specific information within the annual report.-
 1
1 -
2
-
3
-
4
-
5
-
6
-
7
-
8
-
9
-
10
-
11
-
12
-
13
-
14
-
15
-
16
-
17
-
18
-
19
-
20
-
21
-
22
-
23
-
24
-
25
-
26
-
27
-
28
-
29
-
30
-
31
-
32
-
33
-
34
-
35
-
36
-
37
-
38
-
39
-
40
-
41
-
42
-
43
-
44
-
45
-
46
-
47
-
48
-
49
-
50
-
51
-
52
-
53
-
54
-
55
-
56
-
57
-
58
-
59
-
60
-
61
-
62
-
63
-
64
-
65
-
66
-
67
-
68
-
69
-
70
-
71
-
72
-
73
-
74
-
75
-
76
-
77
-
78
-
79
-
80
-
81
-
82
-
83
-
84
-
85
-
86
-
87
-
88
-
89
-
90
-
91
-
92
-
93
-
94
-
95
-
96
-
97
-
98
-
99
-
100
-
101
-
102
-
103
-
104
-
105
-
106
-
107
-
108
-
109
-
110
-
111
-
112
-
113
-
114
-
115
-
116
-
117
-
118
-
119
-
120
-
121
-
122
-
123
-
124
-
125
-
126
-
127
-
128
-
129
-
130
-
131
-
132
-
133
-
134
-
135
-
136
-
137
-
138
-
139
-
140
-
141
-
142
-
143
-
144
-
145
-
146
-
147
-
148
-
149
-
150
-
151
-
152
-
153
-
154
-
155
-
156
-
157
-
158
-
159
-
160
-
161
-
162
-
163
-
164
-
165
-
166
-
167
-
168
-
169
-
170
-
171
-
 172
172 -
 173
173 -
 174
174 -
 175
175 -
 176
176 -
 177
177 -
 178
178 -
 179
179 -
 180
180 -
 181
181 -
 182
182 -
 183
183 -
 184
184 -
 185
185 -
 186
186 -
 187
187 -
 188
188 -
 189
189 -
 190
190 -
 191
191 -
 192
192 -
193
-
194
-
195
-
196
-
197
-
198
-
199
 |
 |

180 Lenovo Group Limited 2013/14 Annual Report
NOTES TO THE FINANCIAL STATEMENTS
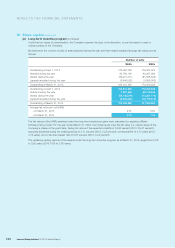
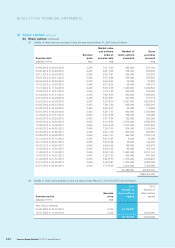
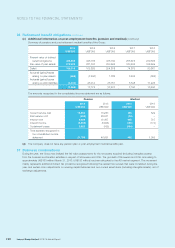
30 Share capital (continued)
(a) Long-term incentive program
(continued)
Under the two types of compensation, the Company reserves the right, at its discretion, to pay the award in cash or
ordinary shares of the Company.
Movements in the number of units of award granted during the year and their related weighted average fair values are as
follows:
Number of units
SARs RSUs
Outstanding at April 1, 2012 172,094,158 176,064,076
Granted during the year 82,786,156 80,087,089
Vested during the year (82,021,317) (81,848,623)
Lapsed/cancelled during the year (8,446,562) (3,896,006)
Outstanding at March 31, 2013 164,412,435 170,406,536
Outstanding at April 1, 2013 164,412,435 170,406,536
Granted during the year 7,057,800 55,119,546
Vested during the year (59,706,679) (71,231,773)
Lapsed/cancelled during the year (8,535,288) (16,790,916)
Outstanding at March 31, 2014 103,228,268 137,503,393
Average fair value per unit (HK$)
– At March 31, 2013 2.37 6.50
– At March 31, 2014 2.15 7.34
The fair values of the SARs awarded under the long-term incentive program were calculated by applying a Black-
Scholes pricing model. For the year ended March 31, 2014, the model inputs were the fair value (i.e. market value) of the
Company’s shares at the grant date, taking into account the expected volatility of 36.62 percent (2013: 39.47 percent),
expected dividends during the vesting periods of 2.71 percent (2013: 2.25 percent), contractual life of 4.75 years (2013:
4.75 years), and a risk-free interest rate of 0.67 percent (2013: 0.24 percent).
The remaining vesting periods of the awards under the long-term incentive program as at March 31, 2014 ranged from 0.08
to 3.92 years (2013: 0.08 to 3.92 years).