Lenovo 2014 Annual Report Download - page 131
Download and view the complete annual report
Please find page 131 of the 2014 Lenovo annual report below. You can navigate through the pages in the report by either clicking on the pages listed below, or by using the keyword search tool below to find specific information within the annual report.-
 1
1 -
2
-
3
-
4
-
5
-
6
-
7
-
8
-
9
-
10
-
11
-
12
-
13
-
14
-
15
-
16
-
17
-
18
-
19
-
20
-
21
-
22
-
23
-
24
-
25
-
26
-
27
-
28
-
29
-
30
-
31
-
32
-
33
-
34
-
35
-
36
-
37
-
38
-
39
-
40
-
41
-
42
-
43
-
44
-
45
-
46
-
47
-
48
-
49
-
50
-
51
-
52
-
53
-
54
-
55
-
56
-
57
-
58
-
59
-
60
-
61
-
62
-
63
-
64
-
65
-
66
-
67
-
68
-
69
-
70
-
71
-
72
-
73
-
74
-
75
-
76
-
77
-
78
-
79
-
80
-
81
-
82
-
83
-
84
-
85
-
86
-
87
-
88
-
89
-
90
-
91
-
92
-
93
-
94
-
95
-
96
-
97
-
98
-
99
-
100
-
101
-
102
-
103
-
104
-
105
-
106
-
107
-
108
-
109
-
110
-
111
-
112
-
113
-
114
-
115
-
116
-
117
-
118
-
119
-
120
-
 121
121 -
 122
122 -
 123
123 -
 124
124 -
 125
125 -
 126
126 -
 127
127 -
 128
128 -
 129
129 -
 130
130 -
 131
131 -
 132
132 -
 133
133 -
 134
134 -
 135
135 -
 136
136 -
 137
137 -
 138
138 -
 139
139 -
 140
140 -
 141
141 -
142
-
143
-
144
-
145
-
146
-
147
-
148
-
149
-
150
-
151
-
152
-
153
-
154
-
155
-
156
-
157
-
158
-
159
-
160
-
161
-
162
-
163
-
164
-
165
-
166
-
167
-
168
-
169
-
170
-
171
-
172
-
173
-
174
-
175
-
176
-
177
-
178
-
179
-
180
-
181
-
182
-
183
-
184
-
185
-
186
-
187
-
188
-
189
-
190
-
191
-
192
-
193
-
194
-
195
-
196
-
197
-
198
-
199
 |
 |
129
2013/14 Annual Report Lenovo Group Limited
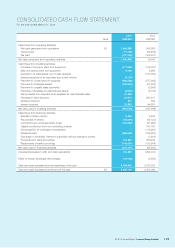
CONSOLIDATED CASH FLOW STATEMENT
For the year ended March 31, 2014
2014 2013
Note US$’000 US$’000
Cash flows from operating activities
Net cash generated from operations 35 1,640,386 245,383
Interest paid (71,199) (33,452)
Tax paid (137,129) (192,401)
Net cash generated from operating activities 1,432,058 19,530
Cash flows from investing activities
Purchase of property, plant and equipment (177,562) (106,331)
Sale of property, plant and equipment 9,106 2,266
Acquisition of subsidiaries, net of cash acquired –(137,052)
Interests acquired in an associate and a joint venture (8,769) –
Payment for construction-in-progress (388,238) (277,003)
Payment for intangible assets (109,544) (57,978)
Payment for prepaid lease payments –(5,026)
Purchase of available-for-sale financial assets (8,550) (4,104)
Net proceeds from disposal of an available-for sale financial asset 41,348 –
Decrease in bank deposits 24,070 294,617
Dividend received 547 362
Interest received 33,893 44,881
Net cash used in investing activities (583,699) (245,368)
Cash flows from financing activities
Exercise of share options 5,946 6,403
Repurchase of shares (45,304) (44,122)
Contributions to employee share trusts (100,688) (91,280)
Capital contribution from non-controlling interest –147,700
De-recognition of contingent consideration –(119,991)
Dividends paid (266,692) (194,676)
Exchange in ownership interest in subsidiary without change in control –(1,493)
Proceeds from bank borrowings 119,292 360,230
Repayments of bank borrowings (142,661) (130,974)
Net cash used in financing activities (430,107) (68,203)
Increase/(decrease) in cash and cash equivalents 418,252 (294,041)
Effect of foreign exchange rate changes (14,190) (9,529)
Cash and cash equivalents at the beginning of the year 3,454,082 3,757,652
Cash and cash equivalents at the end of the year 25 3,858,144 3,454,082