Lenovo 2014 Annual Report Download - page 152
Download and view the complete annual report
Please find page 152 of the 2014 Lenovo annual report below. You can navigate through the pages in the report by either clicking on the pages listed below, or by using the keyword search tool below to find specific information within the annual report.-
 1
1 -
2
-
3
-
4
-
5
-
6
-
7
-
8
-
9
-
10
-
11
-
12
-
13
-
14
-
15
-
16
-
17
-
18
-
19
-
20
-
21
-
22
-
23
-
24
-
25
-
26
-
27
-
28
-
29
-
30
-
31
-
32
-
33
-
34
-
35
-
36
-
37
-
38
-
39
-
40
-
41
-
42
-
43
-
44
-
45
-
46
-
47
-
48
-
49
-
50
-
51
-
52
-
53
-
54
-
55
-
56
-
57
-
58
-
59
-
60
-
61
-
62
-
63
-
64
-
65
-
66
-
67
-
68
-
69
-
70
-
71
-
72
-
73
-
74
-
75
-
76
-
77
-
78
-
79
-
80
-
81
-
82
-
83
-
84
-
85
-
86
-
87
-
88
-
89
-
90
-
91
-
92
-
93
-
94
-
95
-
96
-
97
-
98
-
99
-
100
-
101
-
102
-
103
-
104
-
105
-
106
-
107
-
108
-
109
-
110
-
111
-
112
-
113
-
114
-
115
-
116
-
117
-
118
-
119
-
120
-
121
-
122
-
123
-
124
-
125
-
126
-
127
-
128
-
129
-
130
-
131
-
132
-
133
-
134
-
135
-
136
-
137
-
138
-
139
-
140
-
141
-
 142
142 -
 143
143 -
 144
144 -
 145
145 -
 146
146 -
 147
147 -
 148
148 -
 149
149 -
 150
150 -
 151
151 -
 152
152 -
 153
153 -
 154
154 -
 155
155 -
 156
156 -
 157
157 -
 158
158 -
 159
159 -
 160
160 -
 161
161 -
 162
162 -
163
-
164
-
165
-
166
-
167
-
168
-
169
-
170
-
171
-
172
-
173
-
174
-
175
-
176
-
177
-
178
-
179
-
180
-
181
-
182
-
183
-
184
-
185
-
186
-
187
-
188
-
189
-
190
-
191
-
192
-
193
-
194
-
195
-
196
-
197
-
198
-
199
 |
 |
150 Lenovo Group Limited 2013/14 Annual Report
NOTES TO THE FINANCIAL STATEMENTS
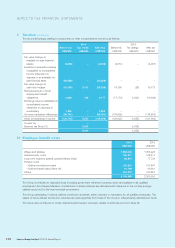
3 Financial risk management (continued)
(d) Fair value estimation (continued)
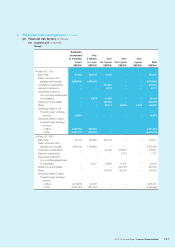
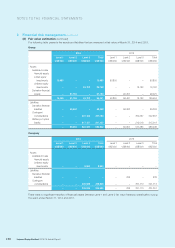
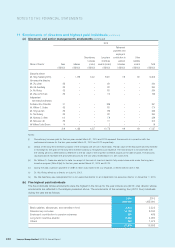
The following table presents the assets and liabilities that are measured at fair value at March 31, 2014 and 2013.
Group
2014 2013
Level 1 Level 2 Level 3 Total Level 1 Level 2 Level 3 Total
US$’000 US$’000 US$’000 US$’000 US$’000 US$’000 US$’000 US$’000
Assets
Available-for-sale
financial assets
Listed equity
investments 10,455 – – 10,455 53,800 – – 53,800
Unlisted equity
investments – – 24,702 24,702 – – 16,162 16,162
Derivative financial
assets –61,184 –61,184 –99,491 –99,491
10,455 61,184 24,702 96,341 53,800 99,491 16,162 169,453
Liabilities
Derivative financial
liabilities –58,462 –58,462 –69,053 –69,053
Contingent
considerations – – 307,183 307,183 – – 302,367 302,367
Written put option
liability – – 217,157 217,157 – – 215,018 215,018
–58,462 524,340 582,802 –69,053 517,385 586,438
Company
2014 2013
Level 1 Level 2 Level 3 Total Level 1 Level 2 Level 3 Total
US$’000 US$’000 US$’000 US$’000 US$’000 US$’000 US$’000 US$’000
Assets
Available-for-sale
financial assets
Unlisted equity
investments – – 8,500 8,500 ––––
Liabilities
Derivative financial
liabilities – – – – –238 –238
Contingent
considerations – – 305,929 305,929 – – 301,113 301,113
– – 305,929 305,929 –238 301,113 301,351
There were no significant transfers of financial assets between Level 1 and Level 2 fair value hierarchy classification during
the years ended March 31, 2014 and 2013.