Lenovo 2014 Annual Report Download - page 21
Download and view the complete annual report
Please find page 21 of the 2014 Lenovo annual report below. You can navigate through the pages in the report by either clicking on the pages listed below, or by using the keyword search tool below to find specific information within the annual report.-
 1
1 -
2
-
3
-
4
-
5
-
6
-
7
-
8
-
9
-
10
-
 11
11 -
 12
12 -
 13
13 -
 14
14 -
 15
15 -
 16
16 -
 17
17 -
 18
18 -
 19
19 -
 20
20 -
 21
21 -
 22
22 -
 23
23 -
 24
24 -
 25
25 -
 26
26 -
 27
27 -
 28
28 -
 29
29 -
 30
30 -
 31
31 -
32
-
33
-
34
-
35
-
36
-
37
-
38
-
39
-
40
-
41
-
42
-
43
-
44
-
45
-
46
-
47
-
48
-
49
-
50
-
51
-
52
-
53
-
54
-
55
-
56
-
57
-
58
-
59
-
60
-
61
-
62
-
63
-
64
-
65
-
66
-
67
-
68
-
69
-
70
-
71
-
72
-
73
-
74
-
75
-
76
-
77
-
78
-
79
-
80
-
81
-
82
-
83
-
84
-
85
-
86
-
87
-
88
-
89
-
90
-
91
-
92
-
93
-
94
-
95
-
96
-
97
-
98
-
99
-
100
-
101
-
102
-
103
-
104
-
105
-
106
-
107
-
108
-
109
-
110
-
111
-
112
-
113
-
114
-
115
-
116
-
117
-
118
-
119
-
120
-
121
-
122
-
123
-
124
-
125
-
126
-
127
-
128
-
129
-
130
-
131
-
132
-
133
-
134
-
135
-
136
-
137
-
138
-
139
-
140
-
141
-
142
-
143
-
144
-
145
-
146
-
147
-
148
-
149
-
150
-
151
-
152
-
153
-
154
-
155
-
156
-
157
-
158
-
159
-
160
-
161
-
162
-
163
-
164
-
165
-
166
-
167
-
168
-
169
-
170
-
171
-
172
-
173
-
174
-
175
-
176
-
177
-
178
-
179
-
180
-
181
-
182
-
183
-
184
-
185
-
186
-
187
-
188
-
189
-
190
-
191
-
192
-
193
-
194
-
195
-
196
-
197
-
198
-
199
 |
 |
19
2013/14 Annual Report Lenovo Group Limited
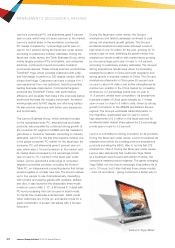
Operating profit in AG decreased to US$69 million and
operating margin was 0.8 percent, a decrease of 0.5
percentage points year-on-year. The decrease was
mainly attributable to continued investments in Brazil
and Latin America during the fiscal year, and the impact
from a temporary interruption in the supply of casing
components for its premium commercial products in fiscal
quarter three which has since seen recovery in fiscal
quarter four.
Asia Pacific (AP)
AP accounted for 16 percent of the Group’s total revenue.
Lenovo’s PC unit shipments in AP increased 3 percent
year-on-year, a 6-point premium to the market driven by
strong growth in Japan. During the fiscal year, Lenovo
achieved robust performance in Japan driven by both
strong commercial and consumer growth momentum.
Lenovo continued to gain share by 0.6 percentage points
to 25.8 percent during the fiscal year, further solidifying its
number one position in Japan. The Group’s market share
in AP increased by 0.9 percentage points year-on-year
to a record-high of 14.8 percent. Lenovo demonstrated
strong growth across PC, smartphones and tablets
during the fiscal year, providing additional strength to the
Group’s strong revenue growth of 12 percent year-on-
year in AP region for the year under review.
Operating profit in AP increased by 74 percent to record-
high US$109 million during the fiscal year and operating
margin was 1.8 percent, an increase of 0.7 percentage
points year-on-year.
Europe-Middle East-Africa (EMEA)
EMEA accounted for 25 percent of the Group’s total
revenue. Lenovo’s PC unit shipments in EMEA grew by 24
percent year-on-year, which was a 35-point premium to
the market. The Group’s market share in EMEA increased
by 4.2 percentage points year-on-year to a record-high
14.8 percent for the fiscal year, according to preliminary
industry estimates. Lenovo achieved the number two
position in EMEA PC market for the first time in the fiscal
year under review, and the Group became number one in
EMEA consumer PC market for the first time in the fiscal
quarter four. Lenovo demonstrated strong performance
across all EMEA regions and customer segments. In the
fiscal quarter four, Lenovo achieved double-digit market
share and top three positions across all EMEA regions,
and reached number one position in 12 EMEA countries,
including key markets, e.g. Germany, Eastern Europe and
Russia.
Driven by the strong performance across all EMEA
regions, operating profit in EMEA increased by 61 percent
to US$188 million during the fiscal year under review
with operating margin improved by 0.5 percentage points
year-on-year to 2 percent.
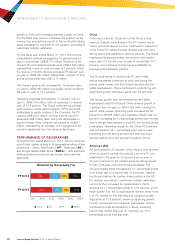
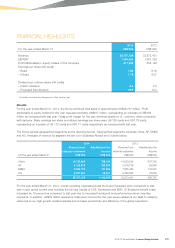
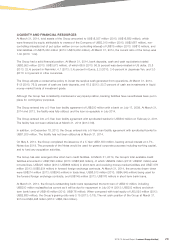
PRCAG
EMEAAP
Lenovo PC Share in 4 GEOs (%)
FY13 FY13
FY13FY13
34.6 10.6
8.2
13.9
FY14 FY14
FY14FY14
35.1
14.8
10.9
14.8
+0.6pts
+2.7pts
+4.2pts
+0.9pts
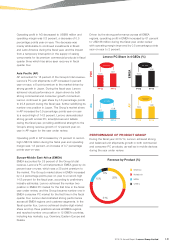
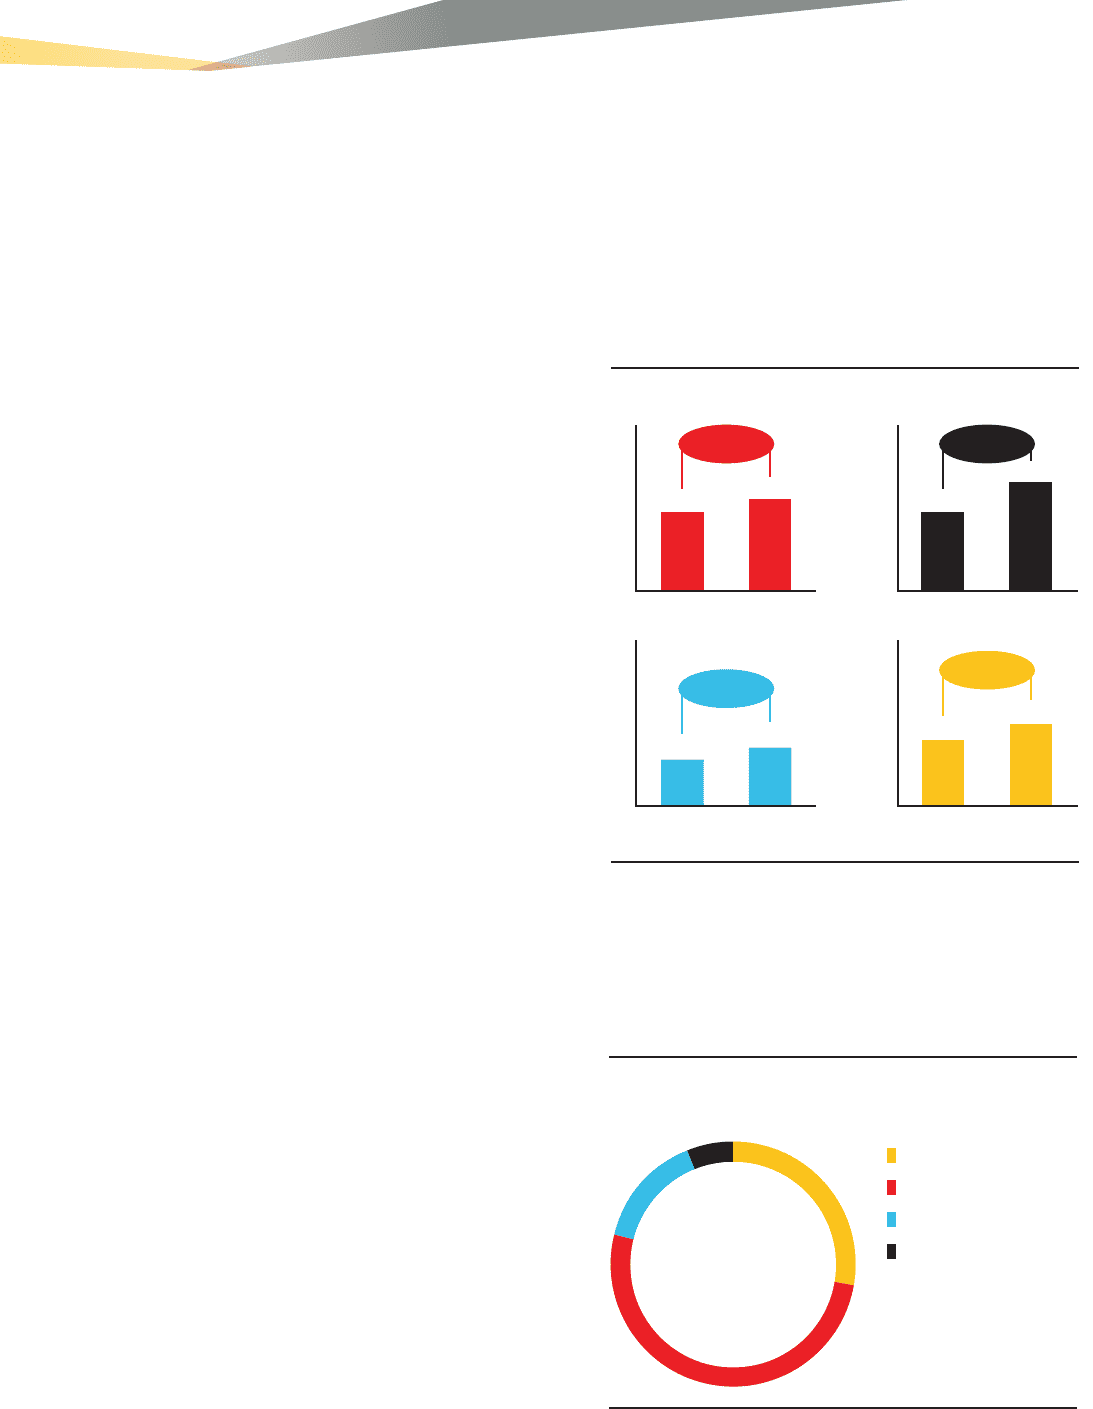
PERFORMANCE OF PRODUCT GROUP
During the fiscal year 2013/14, Lenovo achieved strong
and balanced unit shipments growth in both commercial
and consumer PC products, as well as in mobile devices
during the year under review.
Revenue by Product (%)
Desktop
Notebook
MIDH
Others
6%
15%
51%
28%