ComEd 2013 Annual Report Download - page 93
Download and view the complete annual report
Please find page 93 of the 2013 ComEd annual report below. You can navigate through the pages in the report by either clicking on the pages listed below, or by using the keyword search tool below to find specific information within the annual report.-
 1
1 -
2
-
3
-
4
-
5
-
6
-
7
-
8
-
9
-
10
-
11
-
12
-
13
-
14
-
15
-
16
-
17
-
18
-
19
-
20
-
21
-
22
-
23
-
24
-
25
-
26
-
27
-
28
-
29
-
30
-
31
-
32
-
33
-
34
-
35
-
36
-
37
-
38
-
39
-
40
-
41
-
42
-
43
-
44
-
45
-
46
-
47
-
48
-
49
-
50
-
51
-
52
-
53
-
54
-
55
-
56
-
57
-
58
-
59
-
60
-
61
-
62
-
63
-
64
-
65
-
66
-
67
-
68
-
69
-
70
-
71
-
72
-
73
-
74
-
75
-
76
-
77
-
78
-
79
-
80
-
81
-
82
-
 83
83 -
 84
84 -
 85
85 -
 86
86 -
 87
87 -
 88
88 -
 89
89 -
 90
90 -
 91
91 -
 92
92 -
 93
93 -
 94
94 -
 95
95 -
 96
96 -
 97
97 -
 98
98 -
 99
99 -
 100
100 -
 101
101 -
 102
102 -
 103
103 -
104
-
105
-
106
-
107
-
108
-
109
-
110
-
111
-
112
-
113
-
114
-
115
-
116
-
117
-
118
-
119
-
120
-
121
-
122
-
123
-
124
-
125
-
126
-
127
-
128
-
129
-
130
-
131
-
132
-
133
-
134
-
135
-
136
-
137
-
138
-
139
-
140
-
141
-
142
-
143
-
144
-
145
-
146
-
147
-
148
-
149
-
150
-
151
-
152
-
153
-
154
-
155
-
156
-
157
-
158
-
159
-
160
-
161
-
162
-
163
-
164
-
165
-
166
-
167
-
168
-
169
-
170
-
171
-
172
-
173
-
174
-
175
-
176
-
177
-
178
-
179
-
180
-
181
-
182
-
183
-
184
-
185
-
186
-
187
-
188
-
189
-
190
-
191
-
192
-
193
-
194
-
195
-
196
-
197
-
198
-
199
-
200
-
201
-
202
-
203
-
204
-
205
-
206
-
207
-
208
-
209
-
210
-
211
-
212
-
213
-
214
-
215
-
216
-
217
-
218
-
219
-
220
-
221
-
222
-
223
-
224
-
225
-
226
-
227
-
228
-
229
-
230
-
231
-
232
-
233
-
234
-
235
-
236
-
237
-
238
-
239
-
240
-
241
-
242
-
243
-
244
-
245
-
246
-
247
-
248
-
249
-
250
-
251
-
252
-
253
-
254
-
255
-
256
-
257
-
258
-
259
-
260
 |
 |

•InSeptember 2012, PECO filedan application withtheIRSto changeitsmethodofaccountingfor gas distribution repairsfor the
2011 taxyear.Thenewlyadoptedmethodresultsinacash taxbenefitin 2012 ofapproximately$38million and$41million at
Exelon and PECO, respectively. Exelon currentlyanticipatesthat theIRSwill issue industryguidanceinthe near future.See
Note 3 oftheCombinedNotesto ConsolidatedFinancial Statementsfor discussion regardingtheregulatorytreatment of
PECO’s taxbenefitsfromthe application ofthemethodchange.
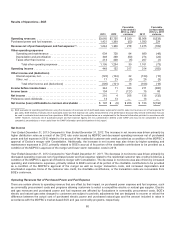
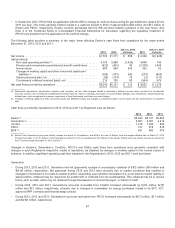
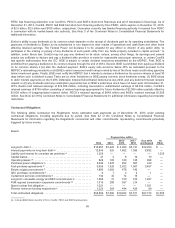
Thefollowingtable providesasummaryofthemajor items affectingExelon’s cash flows fromoperationsfor theyearsended
December 31,2013,2012 and2011:
2013 2012
2013 vs. 2012
Variance 2011
2012 vs. 2011
Variance
Net income.................................................... $1,729$1,171$ 558 $ 2,499 $(1,328)
Add (subtract):
Non-cash operatingactivities(a)................................ 4,159 5,588 (1,429) 4,848 740
Pension andnon-pension postretirement benefitcontributions ...... (422) (462)40(2,360)1,898
Incometaxes............................................... 883544 33949252
Changesinworkingcapital andother noncurrent assetsand
liabilities(b) ............................................... (185) (731) 546 (279) (452)
Option premiums paid, net .................................... (36) (114) 78 (3)(111)
Counterpartycollateral received(paid), net ...................... 21513580(344) 479
Net cash flows providedbyoperations.............................. $6,343$6,131 $212 $ 4,853$1,278
(a)Representsdepreciation,amortization,depletion andaccretion,net fairvalue changesrelatedto derivatives, deferredincometaxes, provision for uncollectible
accounts, pension andnon-pension postretirement benefitexpense,equityin earnings andlossesofunconsolidatedaffiliatesandinvestments, decommissioning-
relateditems, stock compensation expense,impairment oflong-livedassets, andother non-cash charges.
(b) Changesinworkingcapital andother noncurrent assetsandliabilitiesexcludethechangesincommercial paper,incometaxesandthecurrent portion oflong-term
debt.
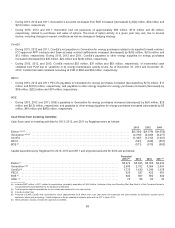
Cash flows providedbyoperationsfor 2013,2012 and2011 by Registrant were asfollows:
2013 2012 2011
Exelon (a)............................................................................... $6,343$6,131 $4,853
Generation (a)............................................................................ 3,887 3,5813,313
ComEd................................................................................. 1,2181,334836
PECO .................................................................................. 747 878 818
BGE (a)................................................................................. 561485 476
(a)Exelon’s andGeneration’s prior year activityincludestheactivityofConstellation,and BGE inthecaseofExelon,fromthemerger effectivedate ofMarch 12,2012
through December 31,2012.Exelon’s andGeneration’s activityfor 2011 is unadjustedfor theeffectsofthemerger. BGE’s prior year activityincludesitsactivityfor
the12months endedDecember 31,2012 and2011.
ChangesinExelon’s, Generation’s, ComEd’s, PECO’s and BGE’s cash flows fromoperationswere generallyconsistent with
changesineach Registrant’s respectiveresultsofoperations, asadjustedbychangesinworkingcapital inthe normal courseof
business. Inaddition, significant operatingcash flowimpactsfor theRegistrantsfor 2013,2012 and2011 were asfollows:
Generation
•During2013,2012 and2011,Generation hadnet (payments) receiptsofcounterpartycollateral of$162million, $95 million and
$(410)million,respectively. Net paymentsduring2013 and2012 were primarilydue to market conditionsthat resultedin
changesto Generation’s net mark-to-market position.Dependingupon whether Generation is in a net mark-to-market liabilityor
asset position,collateral mayberequiredto bepostedwithor collectedfromitscounterparties. This collateral maybeinvarious
forms, such ascash, which maybeobtainedthrough theissuanceofcommercial paper,or lettersofcredit.
•During2013,2012 and2011,Generation’s accountsreceivable fromComEd increased(decreased) by $(16) million,$(15)
million and$12 million,respectively, primarilydue to changesinreceivablesfor energy purchasesrelatedto its SFC, ICC-
approvedRFP contractsandfinancial swap contract.
•During2013,2012 and2011,Generation’s accountsreceivable from PECO increased(decreased) by $(17) million,$17million
and$(210)million,respectively.
87