ComEd 2013 Annual Report Download - page 173
Download and view the complete annual report
Please find page 173 of the 2013 ComEd annual report below. You can navigate through the pages in the report by either clicking on the pages listed below, or by using the keyword search tool below to find specific information within the annual report.-
 1
1 -
2
-
3
-
4
-
5
-
6
-
7
-
8
-
9
-
10
-
11
-
12
-
13
-
14
-
15
-
16
-
17
-
18
-
19
-
20
-
21
-
22
-
23
-
24
-
25
-
26
-
27
-
28
-
29
-
30
-
31
-
32
-
33
-
34
-
35
-
36
-
37
-
38
-
39
-
40
-
41
-
42
-
43
-
44
-
45
-
46
-
47
-
48
-
49
-
50
-
51
-
52
-
53
-
54
-
55
-
56
-
57
-
58
-
59
-
60
-
61
-
62
-
63
-
64
-
65
-
66
-
67
-
68
-
69
-
70
-
71
-
72
-
73
-
74
-
75
-
76
-
77
-
78
-
79
-
80
-
81
-
82
-
83
-
84
-
85
-
86
-
87
-
88
-
89
-
90
-
91
-
92
-
93
-
94
-
95
-
96
-
97
-
98
-
99
-
100
-
101
-
102
-
103
-
104
-
105
-
106
-
107
-
108
-
109
-
110
-
111
-
112
-
113
-
114
-
115
-
116
-
117
-
118
-
119
-
120
-
121
-
122
-
123
-
124
-
125
-
126
-
127
-
128
-
129
-
130
-
131
-
132
-
133
-
134
-
135
-
136
-
137
-
138
-
139
-
140
-
141
-
142
-
143
-
144
-
145
-
146
-
147
-
148
-
149
-
150
-
151
-
152
-
153
-
154
-
155
-
156
-
157
-
158
-
159
-
160
-
161
-
162
-
 163
163 -
 164
164 -
 165
165 -
 166
166 -
 167
167 -
 168
168 -
 169
169 -
 170
170 -
 171
171 -
 172
172 -
 173
173 -
 174
174 -
 175
175 -
 176
176 -
 177
177 -
 178
178 -
 179
179 -
 180
180 -
 181
181 -
 182
182 -
 183
183 -
184
-
185
-
186
-
187
-
188
-
189
-
190
-
191
-
192
-
193
-
194
-
195
-
196
-
197
-
198
-
199
-
200
-
201
-
202
-
203
-
204
-
205
-
206
-
207
-
208
-
209
-
210
-
211
-
212
-
213
-
214
-
215
-
216
-
217
-
218
-
219
-
220
-
221
-
222
-
223
-
224
-
225
-
226
-
227
-
228
-
229
-
230
-
231
-
232
-
233
-
234
-
235
-
236
-
237
-
238
-
239
-
240
-
241
-
242
-
243
-
244
-
245
-
246
-
247
-
248
-
249
-
250
-
251
-
252
-
253
-
254
-
255
-
256
-
257
-
258
-
259
-
260
 |
 |

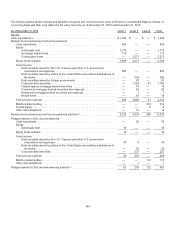
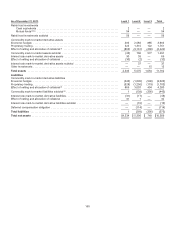
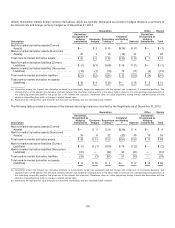
As of December 31, 2012 Level 1 Level 2 Level 3 Total
Commoditymark-to-market derivativeassets
Economic hedges .............................................................. 8613,1736414,675
Proprietarytrading ............................................................. 1,0422,078 733,193
Effectofnettingandallocation ofcollateral (f) ........................................ (1,823) (4,175) (58) (6,056)
Commoditymark-to-market assetssubtotal (g) ....................................... 801,076 656 1,812
Interest rate mark-to-market derivativeassets ....................................... — 114— 114
Effectofnettingandallocation ofcollateral ......................................... — (51)— (51)
Interest rate mark-to-market derivativeassetssubtotal ................................ — 63—63
Other Investments ............................................................. 2—1719
Total assets .................................................................. 4,0625,778 945 10,785
Liabilities
Commoditymark-to-market derivativeliabilities
Economic hedges .............................................................. (1,041)(2,289) (236) (3,566)
Proprietarytrading ............................................................. (1,084) (1,959) (78) (3,121)
Effectofnettingandallocation ofcollateral (f) ........................................ 2,0424,020 256,087
Commoditymark-to-market liabilities(g)(h) ........................................... (83)(228) (289) (600)
Interest rate mark-to-market liabilities.............................................. — (84) — (84)
Effectofnettingandallocation ofcollateral ......................................... — 51—51
Interest rate mark-to-market derivativeliabilitiessubtotal .............................. — (33)— (33)
Deferredcompensation obligation ................................................. — (102)— (102)
Total liabilities ................................................................ (83)(363)(289) (735)
Total net assets ............................................................... $3,979 $ 5,415 $ 656 $10,050
(a) Excludescertaincash equivalentsconsideredto beheld-to-maturityandnot reportedat fairvalue.
(b) Excludesnet assets(liabilities) of $(5) million and$30 million at December 31,2013 andDecember 31,2012,respectively. Theseitems consistofreceivablesrelated
to pendingsecuritiessales, interestand dividendreceivables, andpayablesrelatedto pendingsecuritiespurchases.
(c) Excludesnet assetsof$7million at bothDecember 31,2013 andDecember 31,2012,respectively. Theseitems consistofreceivablesrelatedto pendingsecurities
sales, interestand dividendreceivables, andpayablesrelatedto pendingsecuritiespurchases.
(d) Themutual funds heldbytheRabbi trustsinclude$53million relatedto deferredcompensation and$1million relatedto Supplemental Executive Retirement Plan at
December 31,2013,and$53million relatedto deferredcompensation and$16million relatedto Supplemental Executive Retirement Plan at December 31,2012.
(e) Excludes$32 million and$28million ofthecash surrender value oflifeinsuranceinvestmentsat December 31,2013 andDecember 31,2012,respectively.
(f) Includescollateral postings (received) fromcounterparties. Collateral (received) fromcounterparties, net ofcollateral paid to counterparties, totaled$6million,$(124)
million and$(26) million allocatedto Level 1,Level 2 andLevel 3 mark-to-market derivatives, respectively, asofDecember 31,2013.Collateral (received) from
counterparties, net ofcollateral paid to counterparties, totaled$219million,$(155) million and$(33)million allocatedto Level 1,Level 2 andLevel 3 mark-to-market
derivatives, respectively, asofDecember 31,2012.
(g) TheLevel 3 balancedoesnot includecurrent assetsfor Generation andcurrent liabilitiesfor ComEd of$226million at December 31,2012 relatedto thefairvalue of
Generation’s financial swap contractwithComEd.
(h) TheLevel 3 balanceincludesthecurrent andnoncurrent liabilityof$17million and$176 million at December 31,2013,respectively, and$18million and $49 million
at December 31,2012,respectively, relatedto floating-to-fixedenergy swap contractswithunaffiliatedsuppliers.
167