ComEd 2013 Annual Report Download - page 42
Download and view the complete annual report
Please find page 42 of the 2013 ComEd annual report below. You can navigate through the pages in the report by either clicking on the pages listed below, or by using the keyword search tool below to find specific information within the annual report.-
 1
1 -
2
-
3
-
4
-
5
-
6
-
7
-
8
-
9
-
10
-
11
-
12
-
13
-
14
-
15
-
16
-
17
-
18
-
19
-
20
-
21
-
22
-
23
-
24
-
25
-
26
-
27
-
28
-
29
-
30
-
31
-
 32
32 -
 33
33 -
 34
34 -
 35
35 -
 36
36 -
 37
37 -
 38
38 -
 39
39 -
 40
40 -
 41
41 -
 42
42 -
 43
43 -
 44
44 -
 45
45 -
 46
46 -
 47
47 -
 48
48 -
 49
49 -
 50
50 -
 51
51 -
 52
52 -
53
-
54
-
55
-
56
-
57
-
58
-
59
-
60
-
61
-
62
-
63
-
64
-
65
-
66
-
67
-
68
-
69
-
70
-
71
-
72
-
73
-
74
-
75
-
76
-
77
-
78
-
79
-
80
-
81
-
82
-
83
-
84
-
85
-
86
-
87
-
88
-
89
-
90
-
91
-
92
-
93
-
94
-
95
-
96
-
97
-
98
-
99
-
100
-
101
-
102
-
103
-
104
-
105
-
106
-
107
-
108
-
109
-
110
-
111
-
112
-
113
-
114
-
115
-
116
-
117
-
118
-
119
-
120
-
121
-
122
-
123
-
124
-
125
-
126
-
127
-
128
-
129
-
130
-
131
-
132
-
133
-
134
-
135
-
136
-
137
-
138
-
139
-
140
-
141
-
142
-
143
-
144
-
145
-
146
-
147
-
148
-
149
-
150
-
151
-
152
-
153
-
154
-
155
-
156
-
157
-
158
-
159
-
160
-
161
-
162
-
163
-
164
-
165
-
166
-
167
-
168
-
169
-
170
-
171
-
172
-
173
-
174
-
175
-
176
-
177
-
178
-
179
-
180
-
181
-
182
-
183
-
184
-
185
-
186
-
187
-
188
-
189
-
190
-
191
-
192
-
193
-
194
-
195
-
196
-
197
-
198
-
199
-
200
-
201
-
202
-
203
-
204
-
205
-
206
-
207
-
208
-
209
-
210
-
211
-
212
-
213
-
214
-
215
-
216
-
217
-
218
-
219
-
220
-
221
-
222
-
223
-
224
-
225
-
226
-
227
-
228
-
229
-
230
-
231
-
232
-
233
-
234
-
235
-
236
-
237
-
238
-
239
-
240
-
241
-
242
-
243
-
244
-
245
-
246
-
247
-
248
-
249
-
250
-
251
-
252
-
253
-
254
-
255
-
256
-
257
-
258
-
259
-
260
 |
 |

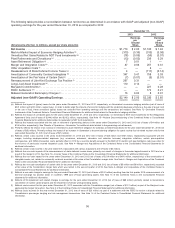
Thefollowingtable providesareconciliation between net incomeasdeterminedinaccordancewithGAAPandadjusted(non-GAAP)
operatingearnings for theyear endedDecember 31,2013 ascomparedto 2012:
December 31,
2013 2012
(All amounts after tax; in millions, except per share amounts)
Earnings
per
Diluted
Share
Earnings
per
Diluted
Share
Net Income .................................................................. $1,719$2.00 $1,160$1.42
Mark-to-Market ImpactofEconomic HedgingActivities(a)............................. (310)(0.35) (310)(0.38)
UnrealizedNet GainsRelatedto NDT FundInvestments(b) ........................... (78) (0.09) (56) (0.07)
Plant Retirementsand Divestitures(c) ............................................. (13)(0.02)2360.29
Asset Retirement Obligation (d) ................................................... 7 0.01 1 —
Merger andIntegration Costs(e).................................................. 87 0.08257 0.31
Other Acquisition Costs(f) ....................................................... — — 3—
Reassessment ofState DeferredIncomeTaxes(g) .................................. 4 — (117) (0.14)
Amortization ofCommodityContractIntangibles(h) .................................. 347 0.41758 0.93
Amortization oftheFairValue ofCertainDebt(i) .................................... (7) (0.01) (9) (0.01)
Remeasurement of Like-Kind ExchangeTaxPosition (j) .............................. 267 0.31 ——
Long-LivedAsset Impairment (k) .................................................. 110 0.14— —
MarylandCommitments(l)....................................................... — — 2270.28
FERCSettlement (m) ........................................................... — — 1720.21
MidwestGeneration Bankruptcy Charges(n)........................................ 160.02 80.01
Adjusted (non-GAAP) Operating Earnings ....................................... $2,149 $ 2.50$2,330 $2.85
(a)Reflectstheimpactof(gains) lossesfor theyearsendedDecember 31,2013 and2012,respectively, on Generation’s economic hedgingactivities(net oftaxesof
$201 million and$200 million,respectively). Inorder to better aligntheimpactsofeconomic hedgingwiththeunderlyingbusiness activity(e.g. thesale ofpower and/
or theuseoffuel), these unrealized(gains) lossesare excludedfromoperatingearnings untilthe transactionsare realized. See Note 12—DerivativeFinancial
InstrumentsoftheCombinedNotesto ConsolidatedFinancial Statementsfor additional detail relatedto Generation’s hedgingactivities.
(b) Reflectstheimpactofunrealizedgainsfor theyearsendedDecember 31,2013 and2012,respectively, on Generation’s NDT fundinvestmentsfor Non-Regulatory
Agreement Units(net oftaxesof$(144) million and$(132)million,respectively). See Note 15—Nuclear DecommissioningoftheCombinedNotesto Consolidated
Financial Statementsfor additional detail relatedto Generation’s NDT fundinvestments.
(c) Reflectstheimpactsassociatedwiththesale or retirement ofgeneratingstationsintheyearsendedDecember 31,2013 and2012 (net oftaxesof$4million and
$106million,respectively). See “ResultsofOperations—Generation”for additional detail relatedto thegeneratingunit retirements.
(d) Primarilyreflectstheimpactofan increaseinGeneration’s asset retirement obligation for asbestosat retiredfossil plantsfor theyear endedDecember 31,2013 (net
oftaxesof $(5) million). Primarilyreflectstheimpactofan increaseinGeneration’s decommissioningobligation for spent nuclear fuel at retirednuclear unitsfor the
year endedDecember 31,2012 (net oftaxesof$(1)million).
(e)ReflectscertaincostsincurredintheyearsendedDecember 31,2013 and2012 (net oftaxesof$33 million and$161million,respectively) associatedwiththe
merger,includingemployee-relatedexpenses(e.g. severance,retirement,relocation andretention bonuses) integration initiatives, certain pre-acquisition
contingencies, and CENG transaction costs, partiallyoffset in 2013 by a one-timebenefit pursuant to theBGE 2012 electric andgas distribution rate caseorder for
therecoveryofpreviouslyincurredintegration costs. See Note 4—Merger andAcquisitionsoftheCombinedNotesto theConsolidatedFinancial Statementsfor
additional information.
(f) Reflectscertaincostsincurredintheyear ended2012 associatedwithvariousacquisitions(net oftaxesof$2million).
(g) Reflectsthe non-cash impactsoftheremeasurement ofstate deferredincometaxes, primarilyasaresult ofchangesinforecastedapportionment in 2013 andasa
result ofthemerger in 2012.See Note 14—IncomeTaxesoftheCombinedNotesto theConsolidatedFinancial Statementsfor additional information.
(h) Reflectsthe non-cash impactfor theyearsendedDecember 31,2013 and2012 (net oftaxesof$219million and $491million,respectively) oftheamortization of
intangible assets, net,relatedto commoditycontractsrecordedat fairvalue at theConstellation merger date.See Note 4—Merger andAcquisitionsoftheCombined
Notesto theConsolidatedFinancial Statementsfor additional information.
(i) Reflectsthe non-cash amortization ofcertaindebtfor theyearsendedDecember 31,2013 and2012 (net oftaxesof$5million and$6million,respectively) recorded
at fairvalue at theConstellation merger date which wasretiredinthesecondquarter of2013.See Note 4—Merger andAcquisitionsoftheCombinedNotesto
ConsolidatedFinancial Statementsfor additional information.
(j) Reflectsa non-cash charge to earnings for theyear endedDecember 31,2013 (net oftaxesof$102 million)resultingfromthefirstquarter 2013 remeasurement ofa
like-kindexchangetaxposition taken on ComEd’s 1999 sale offossilgeneratingassets. See Note 14oftheCombinedNotesto theConsolidatedFinancial
statementsfor additional information.
(k) Reflects2013 impairment andrelatedchargesto earnings for theyear endedDecember 31,2013 (net oftaxesof $69 million)primarilyrelatedto Generation’s
cancellation ofnuclear uprate projectsandtheimpairment ofcertainwindgeneratingassets.
(l)Reflectscostsincurredfor theyear endedDecember 31,2012 associatedwiththeConstellation merger (net oftaxesof$101 million)aspart oftheMarylandorder
approvingthemerger transaction.See Note 4oftheCombinedNotesto ConsolidatedFinancial Statementsfor additional information.
(m) Reflectscostsincurredfor theyear endedDecember 31,2012 (net oftaxesof$23 million)aspart ofasettlement withtheFERCto resolveadispute relatedto
Constellation’s pre-merger hedgingandrisk management transactions. See Note 14oftheCombinedNotesto ConsolidatedFinancial Statementsfor additional
information.
36