ComEd 2013 Annual Report Download - page 212
Download and view the complete annual report
Please find page 212 of the 2013 ComEd annual report below. You can navigate through the pages in the report by either clicking on the pages listed below, or by using the keyword search tool below to find specific information within the annual report.-
 1
1 -
2
-
3
-
4
-
5
-
6
-
7
-
8
-
9
-
10
-
11
-
12
-
13
-
14
-
15
-
16
-
17
-
18
-
19
-
20
-
21
-
22
-
23
-
24
-
25
-
26
-
27
-
28
-
29
-
30
-
31
-
32
-
33
-
34
-
35
-
36
-
37
-
38
-
39
-
40
-
41
-
42
-
43
-
44
-
45
-
46
-
47
-
48
-
49
-
50
-
51
-
52
-
53
-
54
-
55
-
56
-
57
-
58
-
59
-
60
-
61
-
62
-
63
-
64
-
65
-
66
-
67
-
68
-
69
-
70
-
71
-
72
-
73
-
74
-
75
-
76
-
77
-
78
-
79
-
80
-
81
-
82
-
83
-
84
-
85
-
86
-
87
-
88
-
89
-
90
-
91
-
92
-
93
-
94
-
95
-
96
-
97
-
98
-
99
-
100
-
101
-
102
-
103
-
104
-
105
-
106
-
107
-
108
-
109
-
110
-
111
-
112
-
113
-
114
-
115
-
116
-
117
-
118
-
119
-
120
-
121
-
122
-
123
-
124
-
125
-
126
-
127
-
128
-
129
-
130
-
131
-
132
-
133
-
134
-
135
-
136
-
137
-
138
-
139
-
140
-
141
-
142
-
143
-
144
-
145
-
146
-
147
-
148
-
149
-
150
-
151
-
152
-
153
-
154
-
155
-
156
-
157
-
158
-
159
-
160
-
161
-
162
-
163
-
164
-
165
-
166
-
167
-
168
-
169
-
170
-
171
-
172
-
173
-
174
-
175
-
176
-
177
-
178
-
179
-
180
-
181
-
182
-
183
-
184
-
185
-
186
-
187
-
188
-
189
-
190
-
191
-
192
-
193
-
194
-
195
-
196
-
197
-
198
-
199
-
200
-
201
-
 202
202 -
 203
203 -
 204
204 -
 205
205 -
 206
206 -
 207
207 -
 208
208 -
 209
209 -
 210
210 -
 211
211 -
 212
212 -
 213
213 -
 214
214 -
 215
215 -
 216
216 -
 217
217 -
 218
218 -
 219
219 -
 220
220 -
 221
221 -
 222
222 -
223
-
224
-
225
-
226
-
227
-
228
-
229
-
230
-
231
-
232
-
233
-
234
-
235
-
236
-
237
-
238
-
239
-
240
-
241
-
242
-
243
-
244
-
245
-
246
-
247
-
248
-
249
-
250
-
251
-
252
-
253
-
254
-
255
-
256
-
257
-
258
-
259
-
260
 |
 |

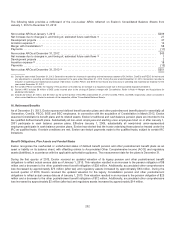
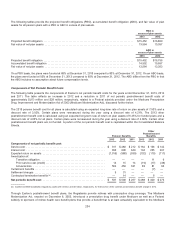
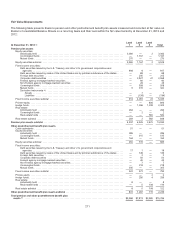
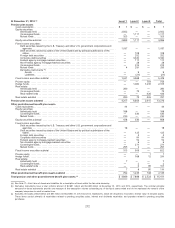
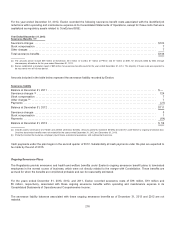
Thefollowingtable providesthecomponentsofExelon’s gross accumulatedother comprehensiveloss andregulatoryassets
(liabilities) that have not been recognizedascomponentsofperiodic benefitcostatDecember 31,2013 and2012,respectively, for
all planscombined:
Pension Benefits
Other
Postretirement Benefits
2013 2012 2013 2012
Prior servicecost(credit)............................................... $ 62$76 $(73)$(107)
Actuarial loss ........................................................ 6,1927,931 474 1,185
Total (a).............................................................. $6,254 $8,007$401 $1,078
(a)Ofthe$6,254 million relatedto pension benefits, $3,523 million and$2,731 million are includedinAOCI andregulatoryassets, respectively, at December 31,2013.
Of the$401 million relatedto other postretirement benefits, $161million and$240million are includedinAOCI andregulatoryassets(liabilities), respectively, at
December 31,2013.Ofthe$8,007million relatedto pension benefits, $4,594 million and$3,413 million are includedinAOCI andregulatoryassets, respectively, at
December 31,2012.Ofthe$1,078 million relatedto other postretirement benefits, $514million and $564 million are includedinAOCI andregulatoryassets,
respectively, at December 31,2012.
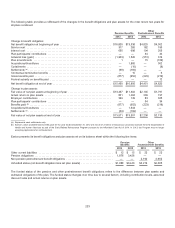
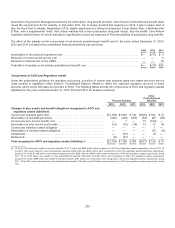
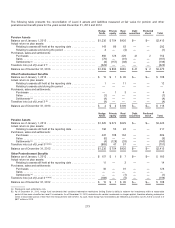
Thefollowingtable providesthecomponentsofExelon’s AOCI andregulatoryassetsat December 31,2013 (includedinthetable
above)that are expectedto beamortizedascomponentsofperiodic benefitcostin 2014. Theseestimatesare subjecttothe
completion ofan actuarial valuation ofExelon’s pension andother postretirement benefitobligations, which will reflectactual census
data asofJanuary1,2014andactual claims activityasofDecember 31,2013.Thevaluation is expectedto becompletedinthefirst
quarter of2014for legacy Exelon plansandinthesecondquarter of2014for legacy Constellation plans.
Pension Benefits
Other
Postretirement Benefits
Prior servicecost(credit) ..................................................... $ 14$(16)
Actuarial loss............................................................... 42732
Total (a)$441$16
(a)Ofthe$441million relatedto pension benefitsat December 31,2013,$232 million and$209million are expectedto beamortizedfromAOCI andregulatoryassetsin
2013,respectively. Of the$16million relatedto other postretirement benefitsat December 31,2013,$7million and$9million are expectedto beamortizedfrom
AOCI andregulatoryassetsin 2013,respectively.
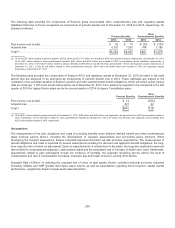
Assumptions
Themeasurement ofthe plan obligationsandcostsofprovidingbenefitsunder Exelon’s definedbenefitandother postretirement
plansinvolvesvariousfactors, includingthedevelopment ofvaluation assumptionsandaccountingpolicy elections. When
developingtherequiredassumptions, Exelon considers historical information aswell asfuture expectations. Themeasurement of
benefitobligationsandcostsisimpactedbyseveral assumptionsincludingthediscount rate appliedto benefitobligations, the long-
termexpectedrate ofreturn on plan assets, Exelon’s expectedlevel ofcontributionsto the plans, the long-termexpectedinvestment
rate creditedto employeesparticipatingincash balance plansandthe anticipatedrate ofincreaseofhealthcare costs. Additionally,
assumptionsrelatedto plan participantsincludetheincidenceofmortality, theexpectedremainingservice period, thelevel of
compensation andrate ofcompensation increases, employee ageandlengthofservice,amongother factors.
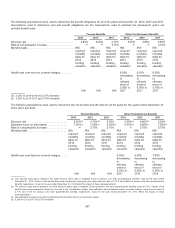
Expected Rate of Return. Inselectingtheexpectedrate ofreturn on plan assets, Exelon considers historical economic indicators
(includinginflation and GDP growth) that impactasset returns, aswell asexpectationsregardingfuture long-termcapital market
performance,weightedbyExelon’s target asset class allocations.
206